

The Anomaly Activity view displays anomalous activity as a bar chart. This view gives you a visual overview of how many anomalies and anomaly clusters occurred compared to all of the records. The number of records that were processed is shown in the millions.
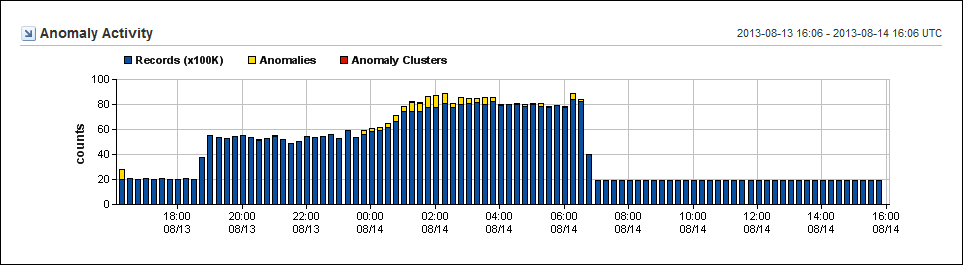
Changing the time frame can show when the issue began and help find patterns.
|
Copyright © 2013 CA.
All rights reserved.
|
|