

The Anomaly Trend view shows the value and probability of the anomaly over time in a trend chart. To display the Anomaly Trend view, click a link in the Date column in either the Anomaly Drill-in view or the Enterprise-Wide Anomalies view.
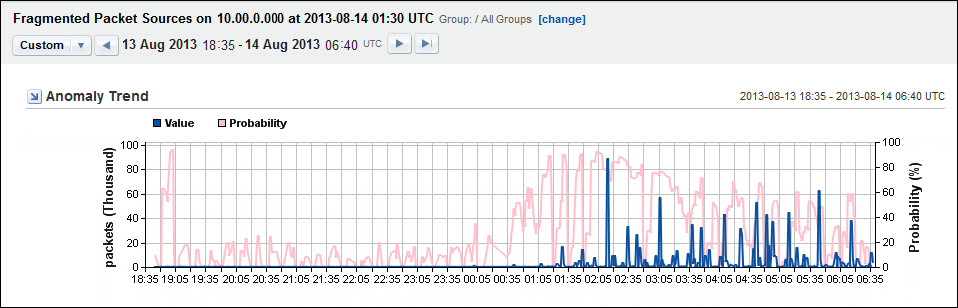
The Anomaly Trend view shows the pattern of deviation from normal network behavior. You can see when the behavior began and how severe the behavior was. A longer term view can help to determine daily, weekly, or monthly patterns.
The recorded values are shown as a blue trend line on the X-Axis. The probability that the behavior is a true anomaly is shown as a pink trend line on the Y-axis.
|
Copyright © 2013 CA.
All rights reserved.
|
|