CA Anomaly Detector Reports › Predefined Reports › Top Anomalies by Interface
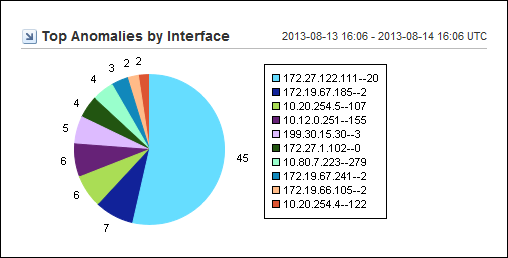
The Top Anomalies by Interface pie chart shows the anomalies for the top 10 interfaces, ranked by number of anomalies. The number of instances are shown next to each pie slice.