

The Top Enterprise-Wide Network Anomalies pie chart shows the top 10 anomaly types for the reporting time frame.
This view shows the type of network traffic that had the highest proportion of anomalous traffic. This data may give you the first insight into poor network performance.
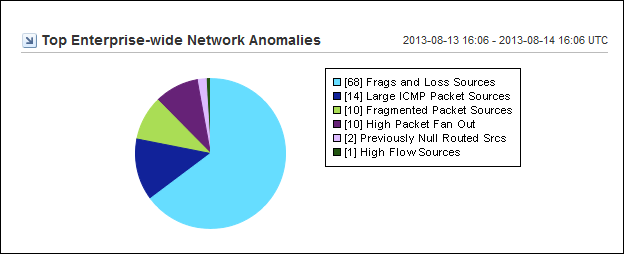
The legend identifies the number of instances and the colors for each anomaly type. Anomaly types are named for the corresponding sensors. For a description of each sensor, see Sensors Overview.
The Top Enterprise-Wide Network Anomalies view is most useful for tracking sudden changes in network behavior. For example, suppose that the Enterprise-Wide Network Anomalies view shows that the Large DNS Packet Sources category accounts for 25% of all potentially anomalous network behavior for the past week. If the summary indicates that Large ICMP Packets account for 50% of such traffic today, you would follow up with an investigation.
|
Copyright © 2013 CA.
All rights reserved.
|
|