

|
|
|
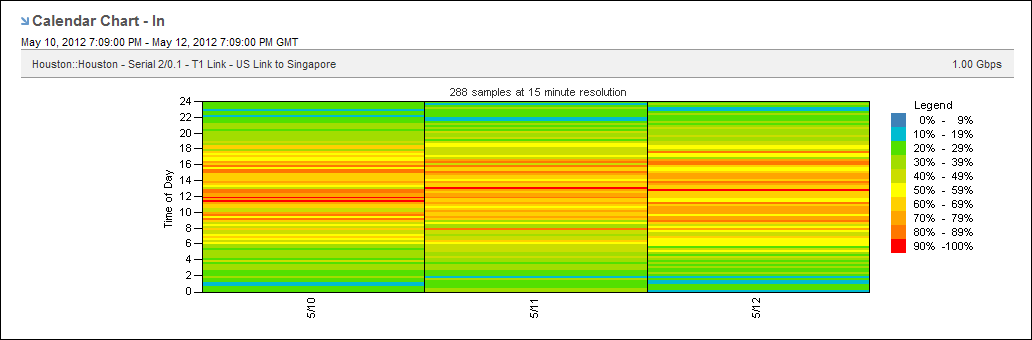
The Calendar Chart helps you detect utilization issues on an interface, determine when the problem started, and pinpoint the time of day the problem occurs. In the example chart, you can see that the utilization level for this interface is often at or above 70 percent. The high utilization level means that the performance of the applications sending data over this link is likely to be degraded at those times. Calendar Charts can also reveal patterns from day to day and from week to week so that you can determine whether a problem regularly occurs at a particular time.
| Copyright © 2012 CA. All rights reserved. | Tell Technical Publications how we can improve this information |