

|
|
|
When you open a Capacity Planning report, the Trend Settings controls are at the top of the page. Display options are on the left and Calculations options are on the right. Use these settings to control the data display and projection calculations in the report.
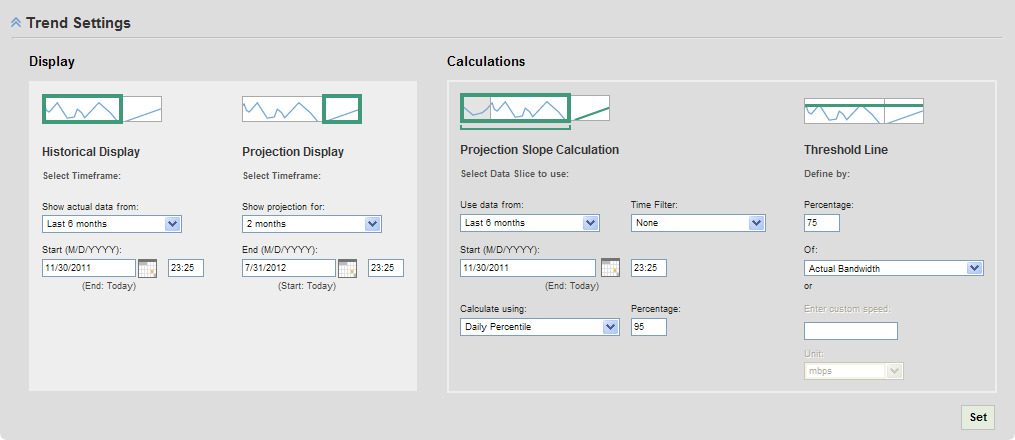
Use the Display options to specify the historical time period and the projection time period displayed in the report. This setting does not determine the data that is used to make projection calculations.
Follow these steps:
You can select a time period that is relative to today’s date, such as Last 7 days, Last 1 month, Last 2 months, and Last 3 months. Alternatively, you can select Custom to specify a specific date.
Note: The report displays the data starting at this time but does not necessarily use this time as the starting point to calculate the projection. For example, if you want the projection to calculate from six months of historical data but want to display only seven days of that data. In this scenario, you would select Last 7 days in this menu.
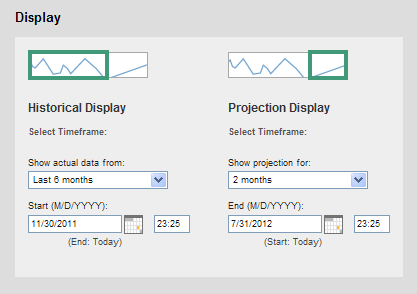
You can select a time period relative to the Historical Display end date (such as 1 month) or you can select Custom to specify a date.
The report views below the Trend Settings regenerate and reflect your changes.
Note: If you make further changes, click Set to apply those settings to the report views.
Use the Calculations options to specify the data, calculation method, and threshold for calculating the projection data. These time period settings do not affect the projection data displayed in the report.
Follow these steps:
You can select a time period that is relative to the current date, such as Last 7 days, Last 1 month, Last 2 months, or Last months. Alternatively, you can select Custom to select a specific start date.
Note: The report uses this starting time for calculations but does not necessarily use this time to display historical data in the report. For example, if you want the projection to calculate from 6 months of historical data but want to display only seven days of that data. In this scenario, you would select ‘Last 6 months’ in this menu.
Note: User accounts that are assigned the Power User or the Administrator role can create custom time filters. For information about creating time filters, see the CA Network Flow Analysis Administrator Guide.
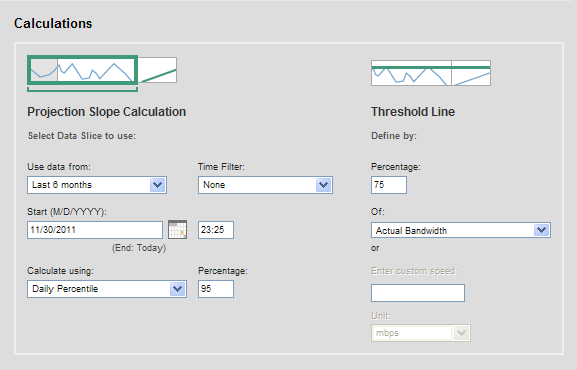
You can select Daily Percentile or Daily Average. To use the Daily Percentile method, enter a value in the Percentage field.
The default measurement is Actual Bandwidth.
The Trend report views regenerate and reflect your changes.
Note: If you make further changes, click Set to apply those settings to the report views.
| Copyright © 2012 CA. All rights reserved. | Tell Technical Publications how we can improve this information |