

|
|
|
The NFA console simplifies viewing and using CA Network Flow Analysis data. Some of the common NFA console features are described in the following topics.
When you view reports in the NFA console, many items are displayed in blue. Click the blue links for interfaces, hosts, conversations, and other items to drill down to additional information about the items.
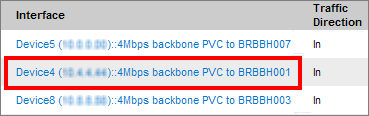
From the Interface report page that opens, you can open other detailed reports specific to the selected interface, host, conversation, or other traffic type.
You can display detailed information for some items in report views by positioning your cursor over the item. For example, place your cursor over a bar that represents an interface to open a Tooltip. The Tooltip shows additional details about the interface, such as its parent router, description, and number of bytes.
Sortable column headings are provided for tables of interfaces, reports, or other items. Click a column heading to sort the data. Click a second time to switch the sort mode between descending and ascending order.
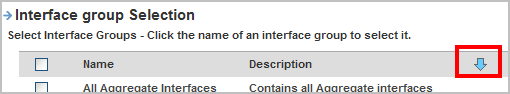
Some selection dialogs include a blue Jump Down arrow, which you can use to jump to the bottom of the page. For example, you can use the Jump Down arrow to locate the Save button quickly in the Interface Group Selection dialog.
When you click an interface link on the Interface page, you drill down to an interface report. To view a report for a different interface, click the [change] link at the top of the page, then select another interface from the Interface Index. The report is updated to show data for the selected interface.
![Use the [change] icon to switch the reported interface.](1907853.png)
The Interface Index page includes a Search utility that you can use to filter the list and locate a router or interface. To perform a search, enter a text string in the text box and click Search.
You can include the wild card * as part of your search term. (The wild card * by itself is not a valid entry.) For example, to search for an IP address you can enter 10.0.7* to display only the addresses that begin with 10.0.7. In this example, the filtered list could include 10.0.7.1, but would not include 10.0.8.1.
The page displays a list of items that match the filter expression.
You can save a report to a comma-separated value (CSV) file.
Follow these steps:
The File Download dialog opens.
The Save As dialog opens.
You can send a displayed report in an email immediately, or you can set up a schedule to generate an updated, complete report automatically as a PDF file.
The Email icon is included at the top of all report views:
If you are logged in with Administrator rights, you can email any of the reports by clicking the Email icon and you can schedule reports to be sent as PDFs by email.
Note: To email reports, an email server must be configured for CA Network Flow Analysis. If no email server is configured, an error message is displayed when you attempt to use the email function. For information about setting up an email server, contact your Administrator or see the CA Network Flow Analysis Administrator Guide.
Follow these steps:
The Email Information dialog opens.
Enter the email address to which you want to send the report page. Separate multiple email addresses with commas.
Enter the subject line for the email.
Enter a message to explain the report or the purpose of the email.
Scheduling Options: Select one of the following options:
Send the report by email immediately.
Schedule the report to generate and send on multiple days a week or to send once a week, month, quarter, or year.
If you select Send on a Schedule, select one of the following options:
Note: Scheduled emails generate a report PDF by using a stored URL address. The saved report definition is used to generate the scheduled report that is sent.
If you have administrator privileges, you can view, edit, or delete the email schedules that you configure in the Administration pages of the NFA console. For more information, see the CA Network Flow Analysis Administrator Guide.
You can print a report view from the browser window or save the report as a PDF file.
The Print icon is included at the top of all report views:
If you are logged in with Administrator rights, you can print any of the reports by clicking the Print icon.
Follow these steps:
A printable version of the report opens in a new browser window.
Your browser displays a Print dialog box, which you use to select a printer and set other printing options.
| Copyright © 2012 CA. All rights reserved. | Tell Technical Publications how we can improve this information |