Views in CA Performance Center › CA Network Flow Analysis Views in CA Performance Center › Interface: ToS Summaries › ToS Summary (Table)
ToS Summary (Table)
The ToS Summary (Table) views show rate, volume, or utilization for the top ToS values of the traffic on a particular interface. You can use this information to compare traffic for each of the top ToS values.
The example graphic is a ToS Summary (Table) view that shows the rate for each listed ToS value. You can configure the view to display ToS rate, utilization, or volume information.
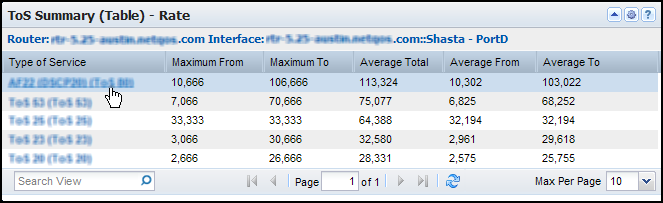
The view contains an interface identification string and a table. The table contains a row for each ToS with the Type of Service identifier (EF/AF, DSCP, and ToS values) and the following rate, volume, or utilization information (by default):
- Rate: Maximum rate of outbound data (Maximum From) and inbound data (Maximum To) for each ToS; average rates of total data (Average Total), outbound data (Average From), and inbound data (Average To) for each ToS.
- Volume: Number of bytes/megabytes of outbound data (From), inbound data (To), and all data (Total) for each ToS.
- Utilization: Maximum percentage of interface capacity that is utilized by the outbound data (Maximum From) and inbound data (Maximum To) for each ToS; and the average utilization by inbound data (Average From), outbound data (Average To), and total data (Average Total) for each ToS.
By default, views and reports show the most recent 24 hours of data.
To see a ToS Summary (Table) view in CA Performance Center, add it to a custom dashboard.
Available Actions for This View
You can perform several actions in this view, including the ones in the following list:
- Change the type of measurement, the view name, and the interface for the report by editing the view settings.
- Re-sort the table data by clicking a column heading. Click again to toggle between descending and ascending order.
- Change the Max Per Page value to show more or fewer items on each table page.
- Change the columns that are shown in the table: Click near a column border, click Columns, then choose the columns that you want to display.
- Click a Type of Service link to display more information about the ToS on Interfaces pages in CA Network Flow Analysis.
Find ToS Summary Tables in the NFA Console
You can display ToS summary tables in the NFA console for any interface you have selected:
- Top N ToS Summary -- Report type: ToS. Filter: Top N ToS. Presentation menu options: Summary Table; Volume.
View: ToS Summary Table for the Top N ToS.
- Protocol Summary for a Single ToS -- Report type: ToS. Filter: Single ToS. Report subtype: Protocols. Subtype filter: Top N Protocols. Presentation menu options: Summary Table; Volume.
Views: ToS Protocol Summary Table for the single ToS.
- Host Summary for a Single ToS -- Report type: ToS. Filter: Single ToS. Report subtype: Hosts. Subtype filter: Top N Hosts. Presentation menu options: Summary Table; Volume.
Views: ToS Hosts Summary Table for the single ToS.
- Conversation Summary for a Single ToS -- Report type: ToS. Filter: Single ToS. Report subtype: Conversations. Subtype filter: Top N Conversations. Presentation menu options: Summary Table; Volume.
Views: ToS Conversations Summary Table for the single ToS.
To display Flow Forensics-level detail, click the Flow Forensics link and run a Flow Forensics report.

