

|
|
|
The Condition Summary shows the status of a product-defined set of conditions. A condition is a characteristic that is being monitored based on the underlying performance attributes of monitored IP resources.
From the IP Summary Display, you can view the conditions of the following resources:
You can perform the following actions from the Condition Summary:
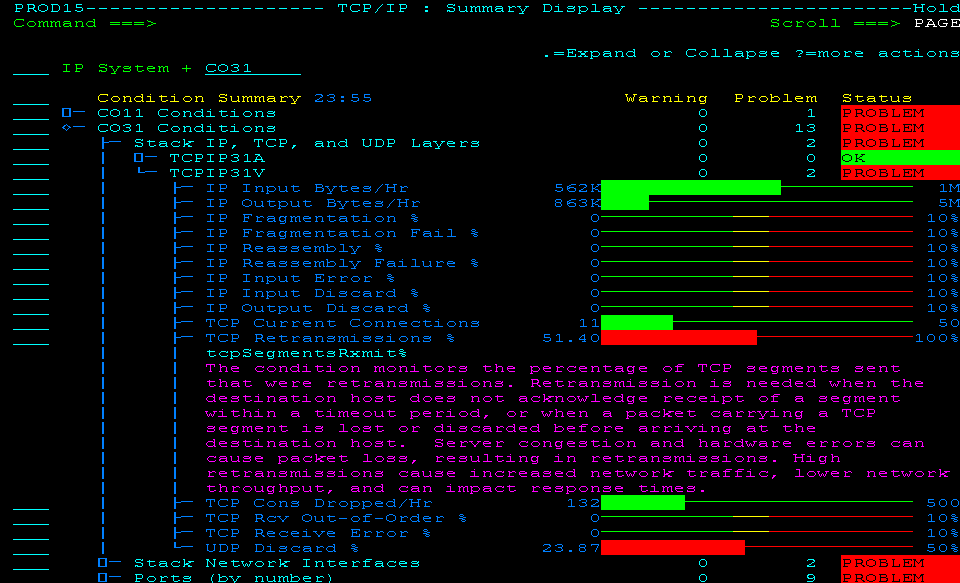
The Stack IP, TCP, and UDP Layers summary displays the status of key conditions for each stack that is monitored on a system. The summary consists of several levels. Each level summarizes the status of the underlying conditions.
Example: Condition of Stack IP, TCP, and UDP Layers Across Multiple Systems
This example shows a partially expanded display in multisystem mode. The display lists the systems monitored by the linked regions. Each system then expands to the condition summaries.
For the TCP Retransmissions % condition, it identifies the attribute and shows the brief explanation about the condition (through the I (Information) action). You can enter the HLP action next to a problematic attribute to review the recommended actions.
The Stack Network Interfaces summary displays the status of key conditions for each stack network interface monitored on a system. It consists of several summary levels. Each level summarizes the status of the underlying conditions.
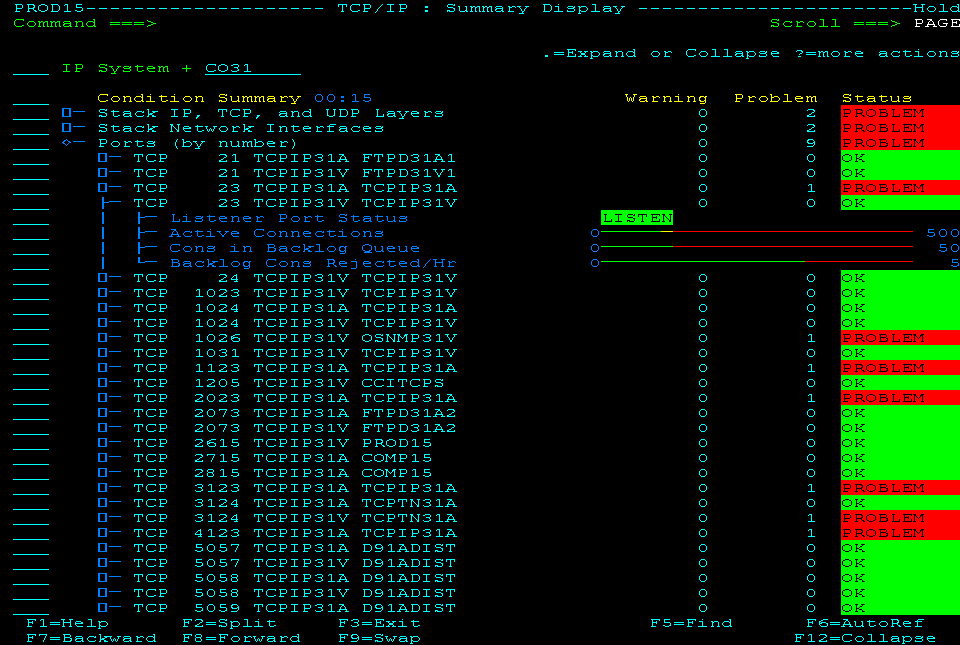
The Ports summary displays the status of key conditions for each port monitored on a system. You can view the ports by protocol and port number (by default or through the P action) or by address space (through the A action). It consists of several summary levels. Each level summarizes the status of the underlying conditions.
Example: Condition of Ports by Port Number
This example shows a partially expanded display. The sorting order is protocol (TCP followed by UDP), port number, stack, and address space.
The Enterprise Extender (EE) summary displays EE resource use, throughput rates, error percentages, and exceptional conditions. Conditions are shown at the EE network level and for up to the ten busiest remote control points (CPs) for which an EE connection is active. The summary consists of several levels. Each level summarizes the status of the underlying conditions.
The APPN/HPR summary displays APPN/HPR RTP pipe utilization and exceptions, at the APPN network level. It consists of several summary levels. Each level summarizes the status of the underlying conditions.
In a production IP environment, Condition Summary usually shows no PROBLEMs, a few WARNINGs (for you to correct the situation before problems occur), and mostly OKs. The following procedure shows you how to diagnose a condition.
To diagnose a condition
The summary expands to its contributors.
A list of conditions is displayed with a bar chart showing their health: red for PROBLEM, yellow for WARNING, and green for OK.
Information about the condition appears. It identifies the attribute monitored for that condition, and provides an explanation and some recommended actions.
| Copyright © 2012 CA. All rights reserved. |
|