

|
|
|
You can display performance graphs from the following locations through the attribute lists on performance history panels:
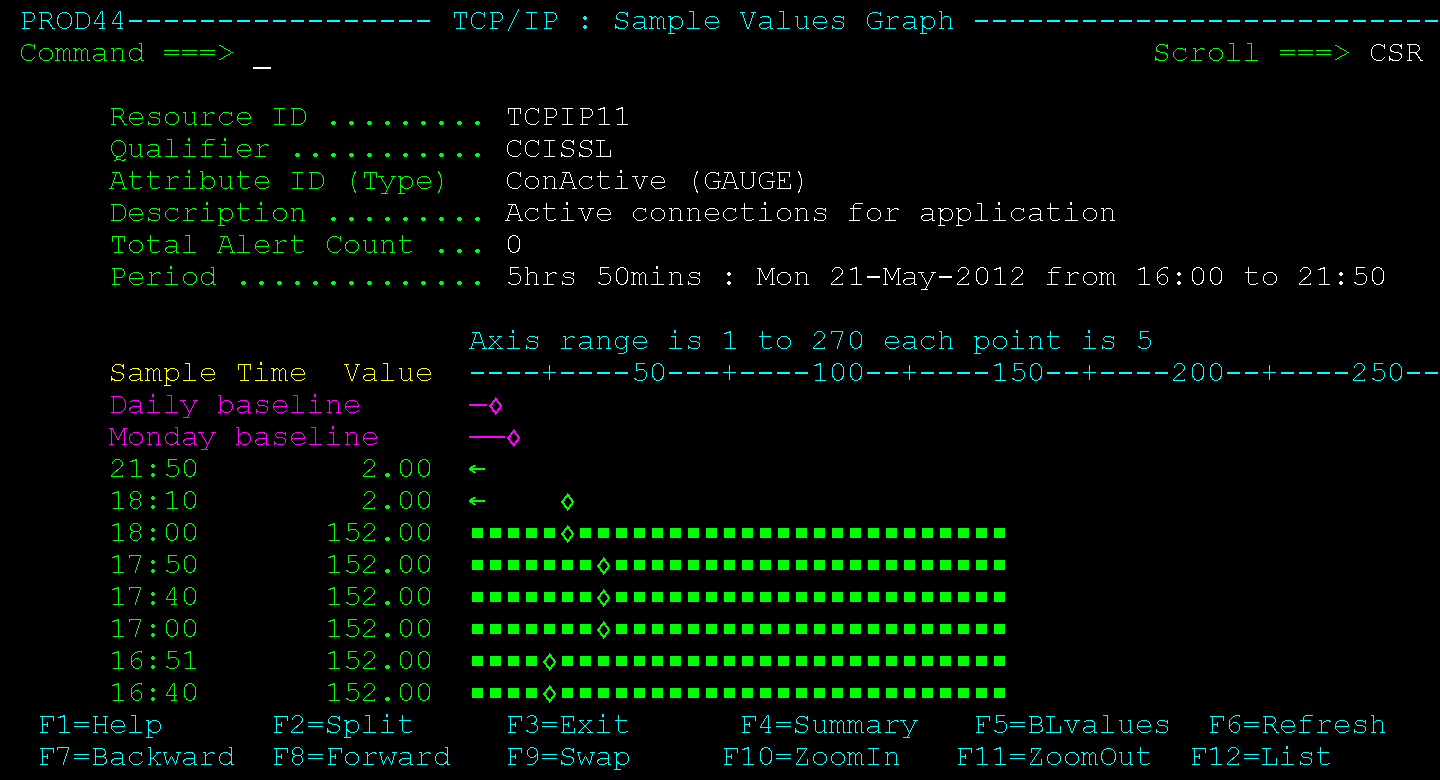
To display the sample values graph, enter D (Samples) next to an attribute of the Gauge or Enumerated type on a History panel.
Example: Values Graph for a ConActive Attribute
This example displays the values graph for the CCISSL/ConActive attribute of the TCPIP11 stack.
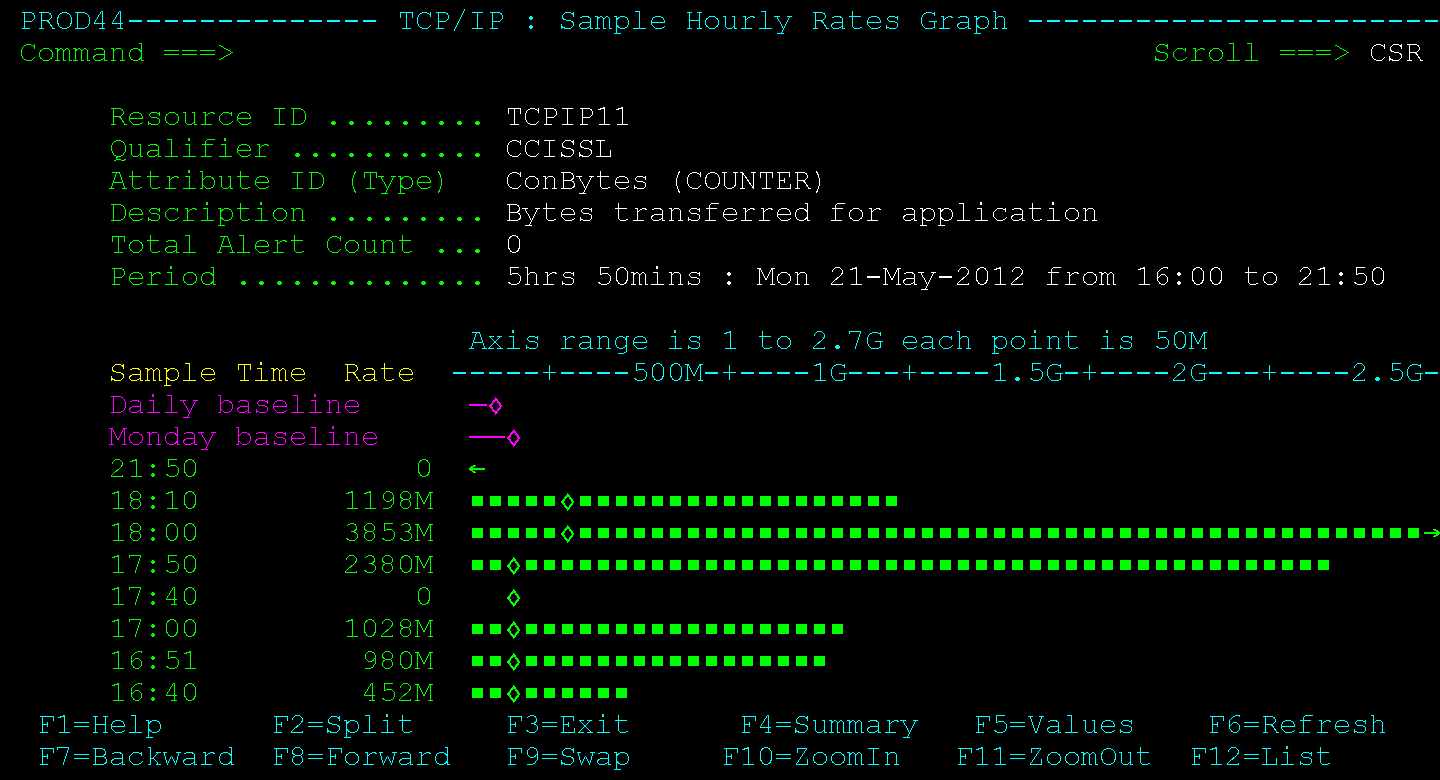
To display the sample hourly rates graph, enter D (Samples) next to an attribute of the Counter or Total type on a History panel.
Example: Hourly Rates Graph for a ConBytes Attribute
This example displays the hourly rates graph for the CCISSL/ConBytes attribute of the TCPIP11 stack.
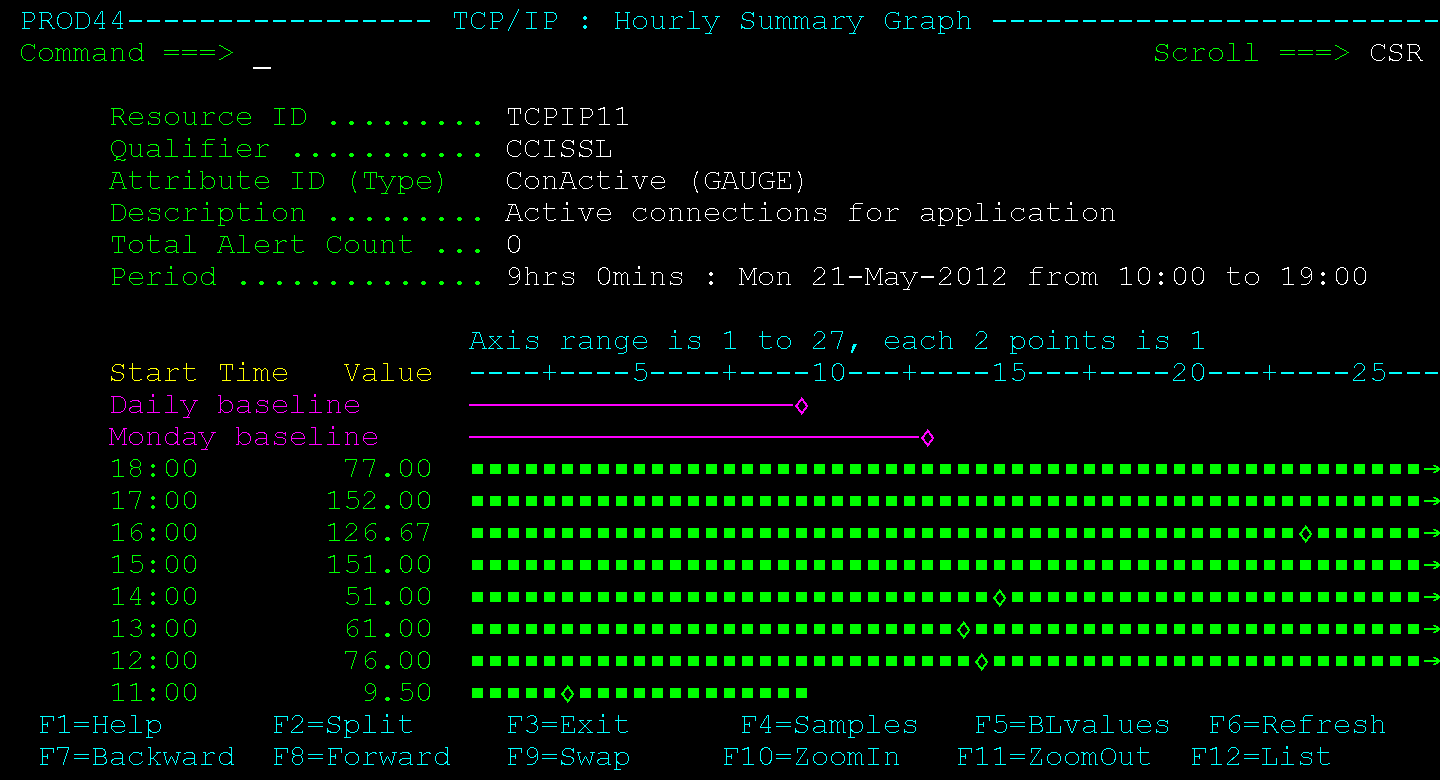
To display the hourly summary graph, enter S (Summary) next to an attribute on a History panel.
Example: Hourly Summary Graph for a ConActive Attribute
This example displays the hourly summary graph for the CCISSL/ConActive attribute of the TCPIP11 stack.
| Copyright © 2012 CA. All rights reserved. |
|