

|
|
|
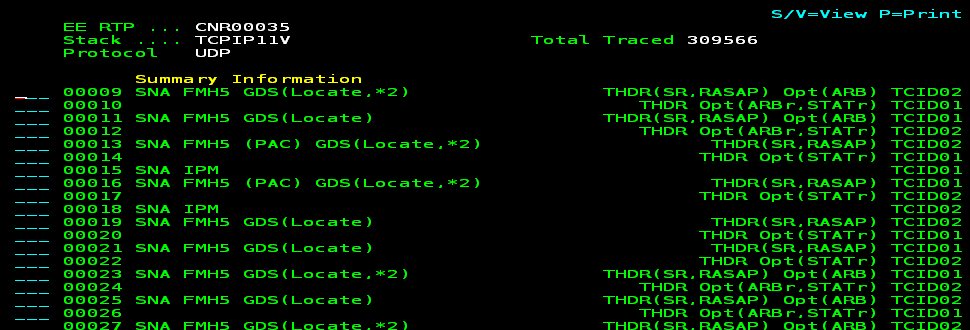
EE traces have summary information that indicates the characteristics of the SNA information contained within the trace.
Although you can trace packets through the various lists from the IP Resource Monitor, the EE SmartTrace Menu puts these trace functions in one place for easy access. You can use the /EETRACE shortcut to access the menu. From the menu, you can trace packets through the following EE components:
Example: Trace an RTP Pipe
This example shows the trace of an RTP pipe that is using a line within the EE. The following process shows you how to perform the trace:
The lines within the EE are listed, for example:
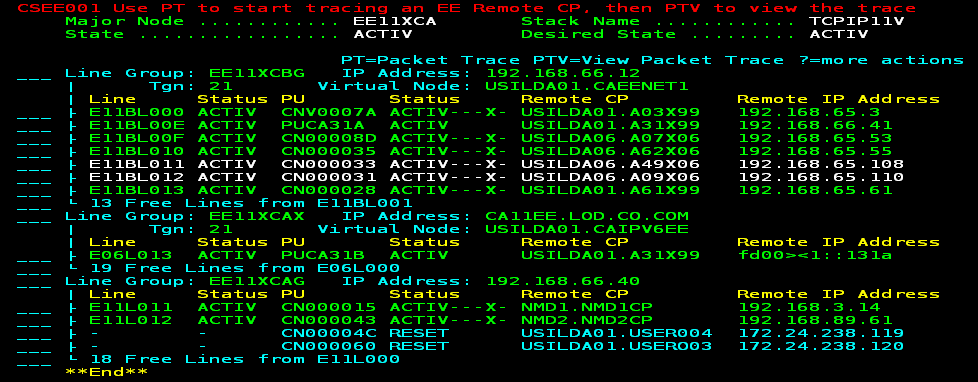
Lines with RTP pipes are in green.
The RTP pipes using the line are listed. The following example shows the displayed information over several screens using the F11 (Right) function key:


You are prompted whether you want to include packets with SNA data only. By default, the trace includes all packets.
The following example shows the summary information for the packets:
| Copyright © 2012 CA. All rights reserved. |
|