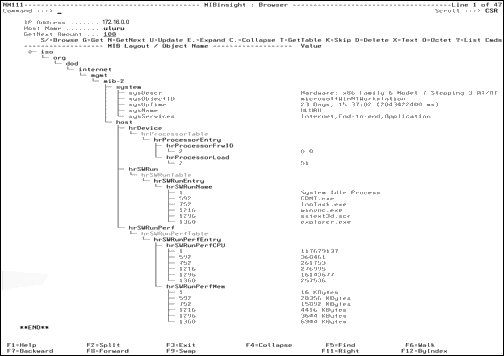
In this example, the enterprise has a PC called Uluru running a mission-critical Windows application. You want to monitor the overall CPU consumption of this PC and the CPU utilization of the application. If there is poor response you may need to remotely diagnose what is happening on this PC. Providing the Windows SNMP service is started on this PC, you can interrogate it using the MIBinsight browser. Among the many management objects implemented by the Windows SNMP service are objects defined in the HOST-RESOURCES-MIB definition. These objects include overall processor load (CPU percentage) and CPU and memory use for each software item running on the PC.
To monitor the CPU consumption and utilization of the application
The TCP/IP : Network Diagnostics Functions menu appears.
The MIBinsight : User Security Details panel appears.
The MIBinsight : Loaded MIBs list appears. This list lets you select the MIB definitions with which to prime your browser
Note: These details default to SNMP Version 2C, with GET and SET Community Names set to public.
The MIBinsight browser appears.
To view the values for a particular object enter G (Get) beside the object. To delete objects from the MIB browser that are not relevant to your current inquiry, enter D (Delete) next to the object. To populate a table of objects, use the T (GetTable) command.
The following shows the result of the browsing:

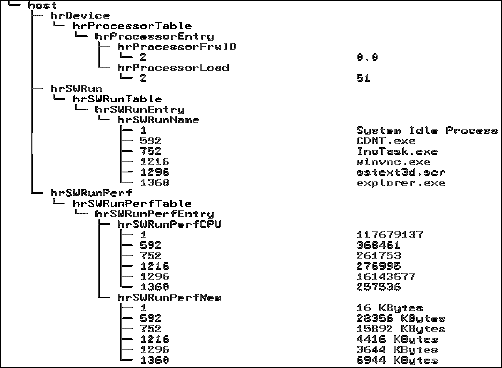
The following provides a more detailed view of the host section:

Example: Results
The hrSWRunTable and the hrSWRunPerfTable use the same index, hrSWRunIndex. This index corresponds with the Process ID displayed in the Processes List of the Windows Task Manager display. There were more than six tasks running on Uluru at the time but only the six tasks listed were selected. Likewise, all attributes have been deleted from the hrSWRunTable except for hrSWRunName.
The previous display shows that the overall CPU usage on the PC at present is 51% utilization - nothing to worry about. The display also indicates that the task with the highest CPU utilization is the System Idle Process, which has used 117,679,137 centiseconds (13.62 days) of CPU since the PC was booted over 23 days ago (sysUpTime). The second highest user of CPU is task ID 1296 - sstext3d.scr - the screen-saver. The third highest CPU user is task ID 592 - CDNT.exe. This task has used a total of 368,461 centiseconds (61 minutes). It is also the highest user of memory, currently consuming 28,356 Kilobytes. This may be the application we are interested in monitoring. Enter G (Get) next to the 592 index for hrSWRunPerfCPU and hrSWRunPerfMem to display the latest CPU and memory figures for this task, enabling you to monitor its current utilization.
If this application is critical to the enterprise, it would be advisable to define Uluru as an IP node and monitor it. It would also be advisable to define hrSWRunPerfCPU and hrSWRunPerfMem as Data Sampling Framework attributes to monitor, optionally filtering both attributes for task 592. After they are defined, you can monitor these attributes for the Uluru IP Node and issue alerts when the CPU or memory utilization for this task exceeds or falls under a defined threshold.
The screen width is 120 characters. The MIBinsight browser is designed to use the maximum screen width available to your 3270 session. If you have a session defined as 160 characters wide, the MIBinsight browser uses this full width. This is useful when displaying long OIDs and their associated values. It is also useful when displaying the full SNMP tree.
The MIBinsight Browser default view is a flat view with only tables, table entries, and tabulated objects nested; however, to the full SNMP structure (as in the above example), enter the TREE ON command at the command line.
The default sort order for tabulated objects is indexes in attributes (by Attribute), and this is the order displayed. For example, the display shows all indexed values for hrSWRunPerfCPU before displaying all indexed values for hrSWRunPerfMem. This is also the order in which objects are accessed from a MIB. However, the MIBinsight browser lets you resort tabulated objects to display them by Index. This is useful when you want to see all attributes and their values for each table entry. You can toggle the sort order between by Attribute and by Index using F12.
Press F6 (Walk) to continue walking through a MIB. As new objects are browsed they are dynamically added to the MIBinsight browser display.
| Copyright © 2012 CA. All rights reserved. |
|