

|
|
|
The following describes the ReportCenter data life cycle. The ConTotalConnects attribute is used to track what happens to the one hourly summary values sent to ReportCenter. This attribute indicates how many connections are made to a certain stack.
As an IP connection is made, it is accumulated into ConTotalConnects for the associated IP stack. You can access and view these individual connection events from your product region's History Data menu (/IPHIST shortcut).
When an hour passes, hourly aggregates of all the connection workload attributes are available for viewing (WC command from the IP Resource Monitor).
Because the Send to ReportCenter flag is set to YES for connection workload monitoring for this stack, these hourly summaries are passed to a ReportCenter procedure.
The ReportCenter procedure transforms the attributes and values to an XML document.
The region sends the XML document over the socket connection to the ReportCenter Java Task.
The ReportCenter Java Task passes the XML document to its Data Warehouse service.
The Data Warehouse service parses the XML and produces the SQL INSERT and UPDATE statements for the attributes and their values.
The Data Warehouse service calls the JDBC interface with the SQL statements required to add the data to the database. The service then processes or waits for the next XML document. This service can get busy.
Hourly values for ConTotalConnects for this stack for the last hour are now in the database. To see these values, run a related report, such as Stack Connection Analysis, for a time frame of TODAY. This reports on the hourly intervals for today.
At the daily housekeeping time, the Java Task starts the Aggregation service. This service aggregates every hourly attribute value in the database into a daily value. Daily values for ConTotalConnects for this stack for yesterday are now in the database. To see these values, run a related report for an appropriate time frame (for example, LAST 7 DAYS, LAST 14 DAYS, and so on). This reports on the daily intervals.
The first time that the Aggregation service runs in a new calendar month, it also aggregates every daily attribute value in the database into a monthly value. Monthly values for ConTotalConnects for this stack for the last month are now in the database. To see these values, run a related report for quarterly or yearly time frames. This reports on the monthly intervals.
Once a week, the Java Task starts the Expiry service. This service deletes stale data from the database. You can customize the rules that control how long data from different monitoring applications is retained.
Key attributes such as ConTotalConnects can appear in many reports. The following examples show the different ways ReportCenter can present this single attribute.
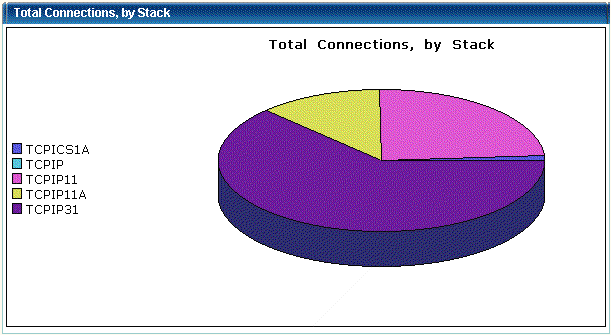
Example: Total Connections by Stack
The Connection Stack Overview report includes, for every stack, the total ConTotalConnects value for the specified time frame. Use this report section to see which stack had the most connection traffic overall.
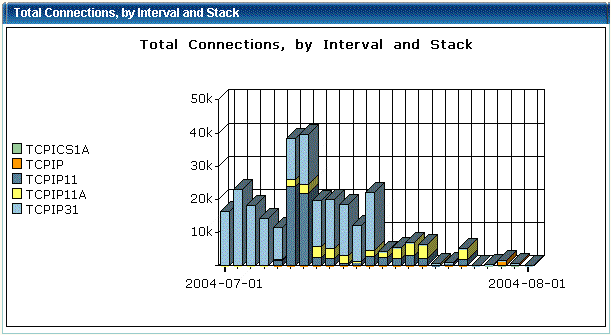
Example: Total Connections by Interval and Stack
The Connection Stack Overview report also includes the ConTotalConnects value per interval by stack. Use this report section to see which were the busiest intervals overall for connection activity and the contribution of each individual stack to the total activity.
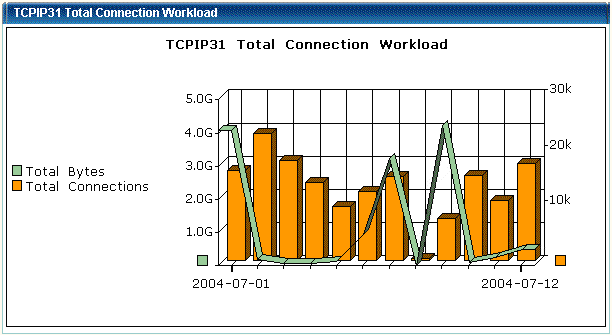
Example: Total Connection Workload
The Connection Stack Analysis report includes, for one stack, the ConTotalConnects and ConTotalBytes values per interval. Use this report section to see when this stack had the most connection activity.
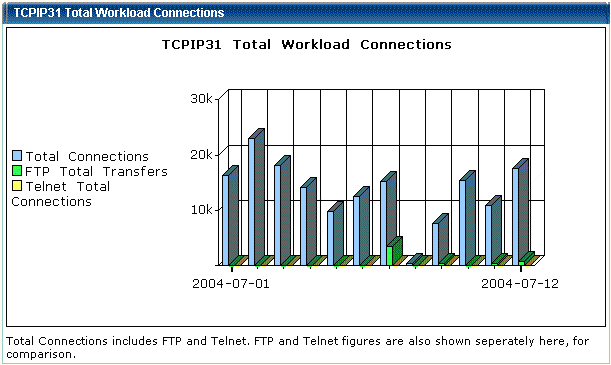
Example: Total Workload Connections
The Stack Workload Analysis report includes, for one stack, the ConTotalConnects value per interval compared with the FTPTotalXfers and TelTotalCconnects values for the same interval. Use this report section to compare the levels of FTP, Telnet, and connection activity.
The available reports appear under the expanded ReportCenter, Reports option on the WebCenter Menu. Place your mouse over a report name for a description of the report. In general, Overview reports compare all monitored resources of the same type, while Analysis reports examine one specific resource.
Reports are updated in response to customer feedback. New and enhanced reports are distributed by product Authorized Program Analysis Reports (APARs). We welcome any comments and suggestions about reports. Contact Technical Support with any report-related suggestions. They will pass your comments to the CA NetMaster development team.
| Copyright © 2012 CA. All rights reserved. |
|