

|
|
|
In CA NetMaster NM for TCP/IP regions, you can display the most recent hourly summary values using the 3270 IP Resource Monitor or IP Node Monitor. Display these values after a few hours of data collection.
Always do this check after activating new performance monitoring and adding more monitored attributes.
Displaying these values on the data region verifies that the data is correctly monitored and collected at the source.
This check is useful when troubleshooting; it can help isolate the cause of missing data problems.
Follow these steps:
The IP Node Monitor appears.
The IP Resource Monitor appears.
The History panel appears.
This list shows all attributes currently being monitored for this resource and type of monitoring. Verify that all the attributes you think your are monitoring appear on the list.
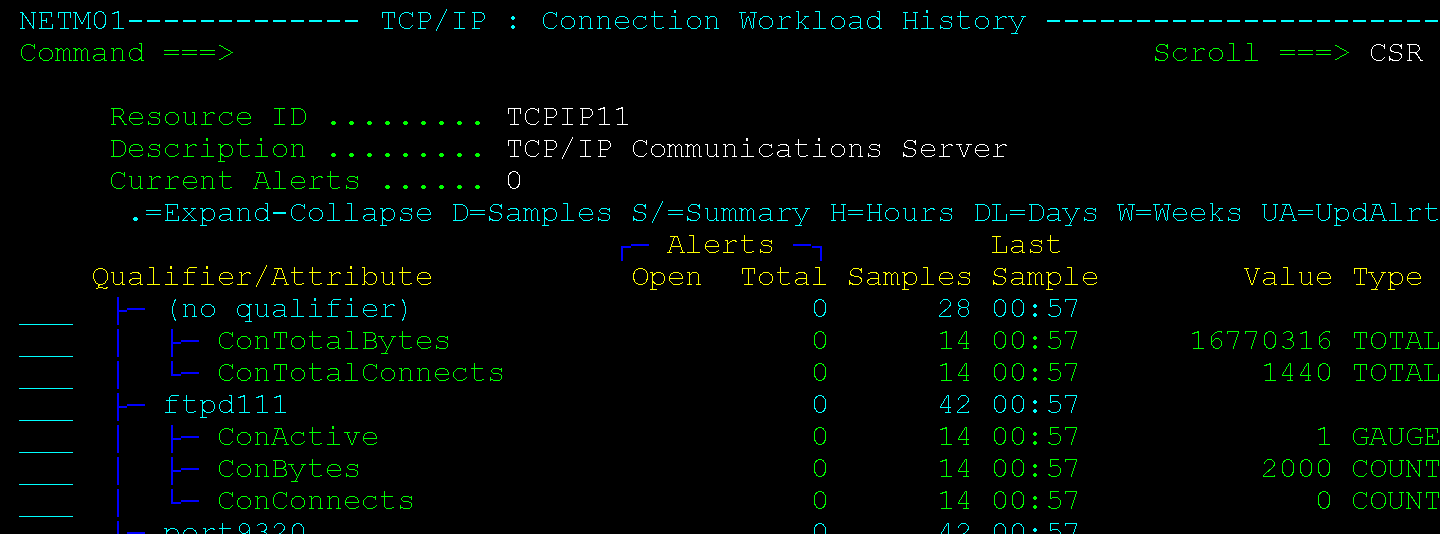
To display the hourly summary graph, enter S next to an attribute name. This displays the hourly summary values for that attribute.
These hourly summary values are ReportCenter's raw data. These are the same values that the region sends to the ReportCenter Java Task. They are added to the ReportCenter database, as hourly facts.
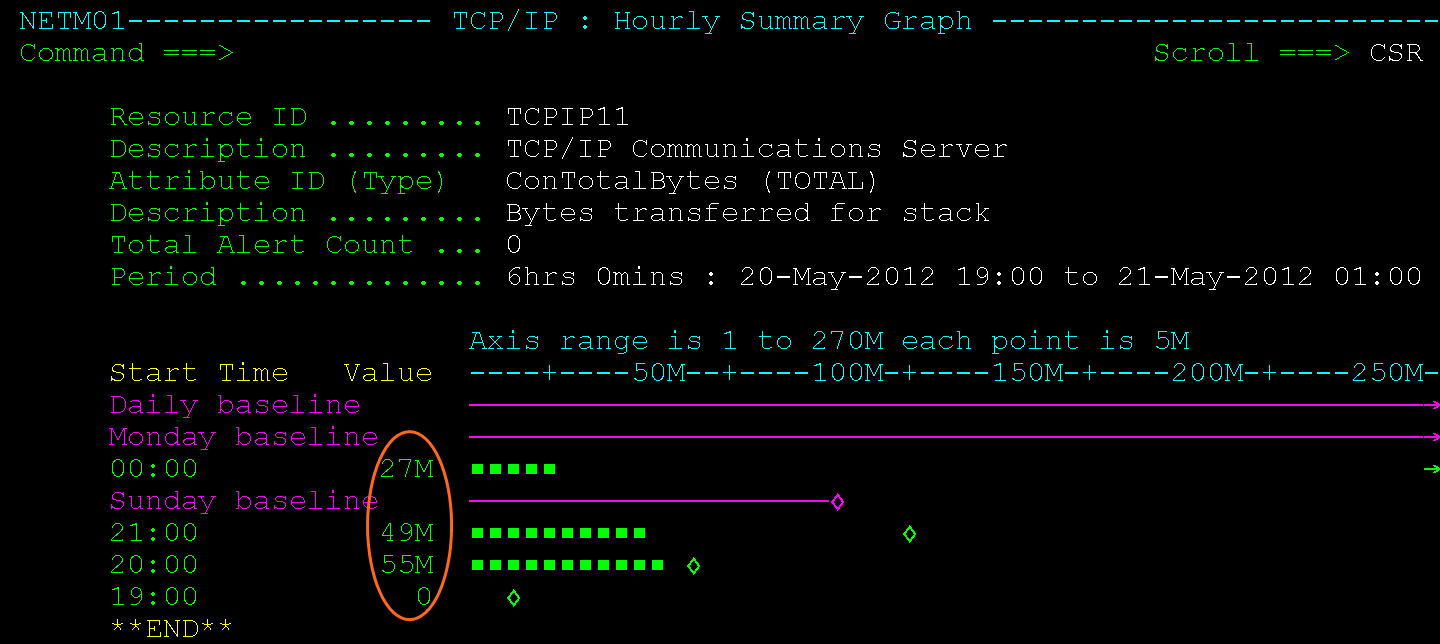
If the values look healthy, then the data is being correctly collected.
If not, check the individual samples (F4 (Samples)) or the Attribute List, for data sampling error messages. Incorrect SNMP setup is a common cause of errors.
| Copyright © 2012 CA. All rights reserved. |
|