

|
|
|
The Active File Transfer Monitor is where you can monitor the status and view the details of file transfers as they occur, and are detected by the region. You access the monitor using the /AFTMON panel shortcut.
You should be able to see the FTP transfers immediately. To see transfers by a supported application such as CA SOLVE:FTS and CONNECT:Direct, you must define a manager resource for it in the loaded system image. To see transfers by other methods, you must use the generic data transfer API.
Failed or completed transfers are removed from the monitor after a period specified in the FTMONITOR region parameter group, but you can still view their details in the history database.
Example: Active File Transfer Monitor Display
The following illustration shows an example of the information displayed on the monitor. You can press F11 to scroll to the right to display additional information such as information about the target (the recipient of a transfer).
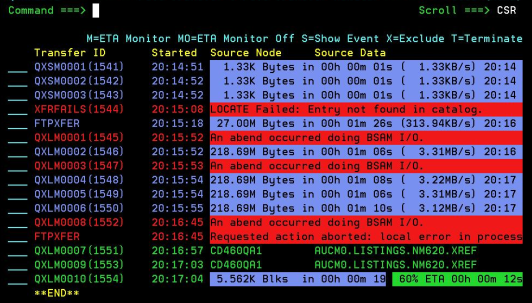
The example shows sample transfers with various statuses:
XFRFAILS(1544) 20:15:08 LOCATE Failed: Entry not found in catalog.
These transfers are displayed in red.
QXSM0001(1541) 20:14:51 1.33K Bytes in 00h 00m 01s ( 1.33KB/s) 20:14...
These transfers are displayed in blue.
QXLM0007(1551) 20:16:57 CD46OQA1 AUCM0.LISTINGS.NM620.XREF
These transfers are displayed in green.
If estimated-time-of-arrival (ETA) monitoring is enabled for a transfer, it shows both the bytes transferred so far and the estimated time for the transfer to complete, as indicated by the last transfer listed in the illustration.
Note: For more information about ETA monitoring, see the User Guide.
| Copyright © 2008 CA. All rights reserved. |
|