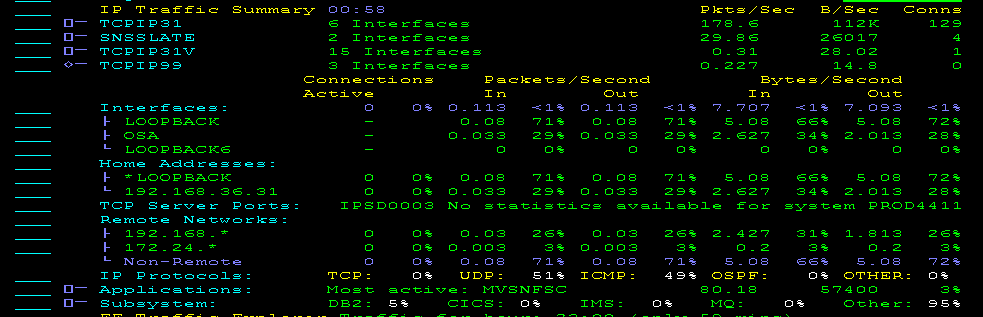
The IP Traffic Summary summarizes your IP network traffic.
From the IP Summary Display, you can access the following IP traffic summaries (when sorted by system). You can also sort the summaries by stacks.
You can choose to sort IP Traffic Summary by system or stack.
To sort the display by system, enter SYS beside IP Traffic Summary.
To sort the display by stack, enter STK beside IP Traffic Summary.
Note: To apply a sort order as the default, you can enter it in your profile by entering PROFILE at the Primary Menu.
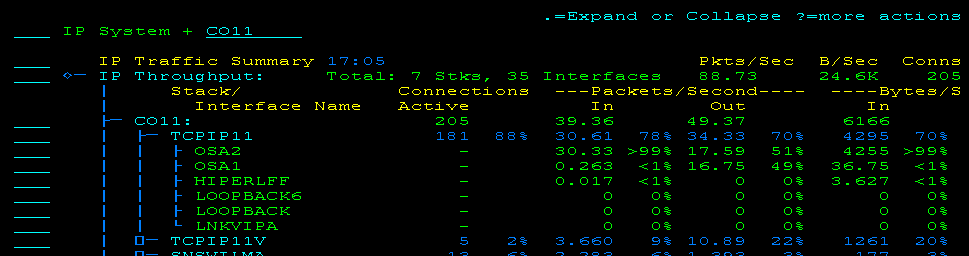
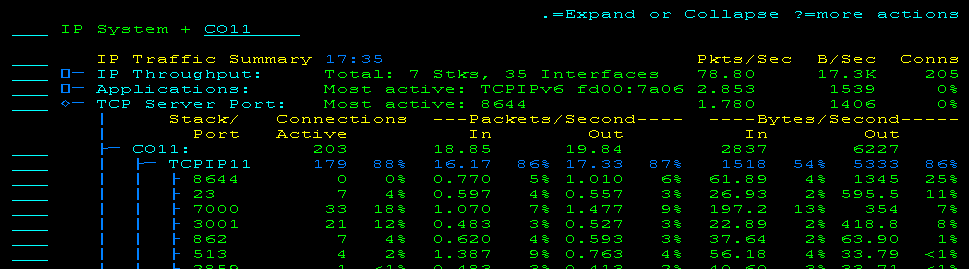
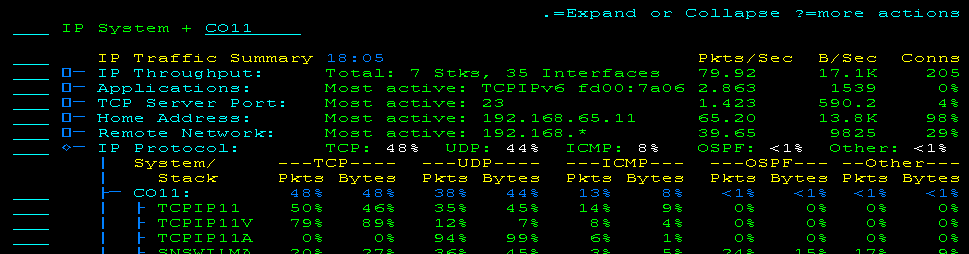
IP Throughput summarizes the TCP/IP throughput for the specified system. The summary shows the total number of stacks and interfaces for that system. It also shows the packet and byte rates, and the number of connections for the system.
Example: IP Traffic for Monitored Stacks and Interfaces
The following example shows an expanded display.
The displayed percentages have the following meanings:
Entering S next to an interface displays the Interface Traffic Statistics panel. The panel displays the IP traffic statistics for the interface. It also includes the relative traffic for the applications that used the interface, enabling you to see which applications are making the most use of the interface.
Example: Interface Traffic by Applications
The following example shows the distribution of traffic on an interface by applications:

Applications summarizes the IP usage by business applications for the specified system. The summary shows the busiest application for that system, the packet and byte rates, and connections for the busiest application as a percentage of the total for the system.
Example: IP Traffic for Defined Business Applications
This example shows a partially expanded display. The display lists the defined business applications that have IP traffic on the system.
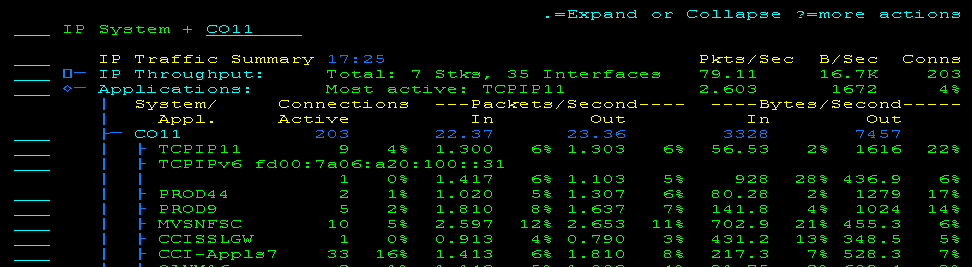
During Express Setup, you can request that business applications be defined for the discovered address spaces. You can also define applications manually through the Maintain Application Name Definitions menu option. The shortcut is /IPAPPLS.
Note: For more information about business applications, see the Implementation Guide.
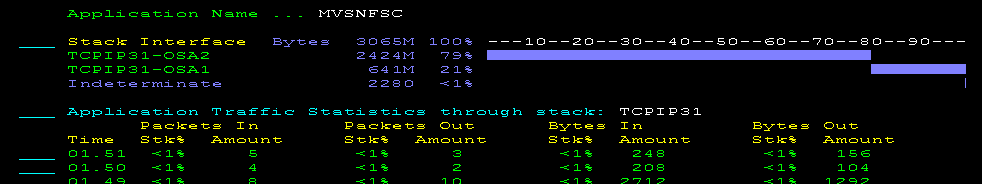
Entering S next to an application displays the Application Traffic Statistics panel. The panel displays the IP traffic statistics for the business application. It also includes the relative traffic over the interfaces used by the application, enabling you to see of which interfaces the application is making the most use.
Example: Application Traffic by Interfaces
The following example shows the traffic distribution of an application over two OSAs:
TCP Server Port summarizes the statistics of TCP server ports for the specified system. The summary shows the busiest port for that system, the packet and byte rates, and connections for the busiest port as a percentage of the total for the system.
Example: IP Traffic for TCP Server Ports
The following example shows a partially expanded display.
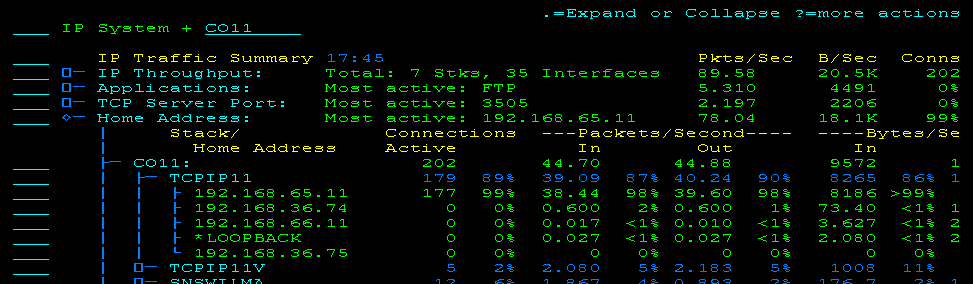
Home Address summarizes the statistics of monitored home addresses for the specified system. The summary shows the busiest home address for that system, the packet and byte rates, and connections for the busiest home address as a percentage of the total for the system.
Example: IP Traffic for Home Addresses of Monitored Stacks
The following example shows a partially expanded display.
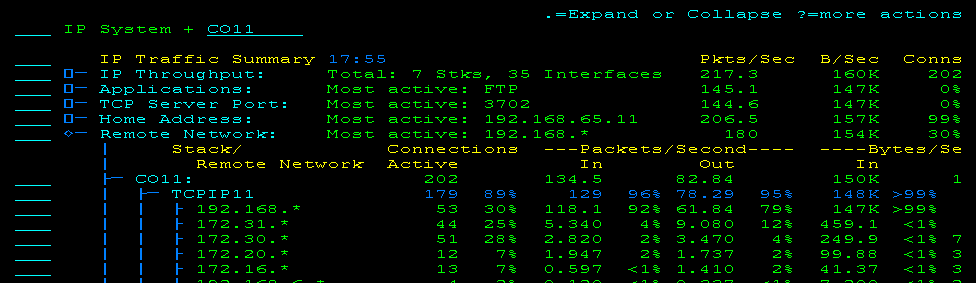
Remote Network summarizes the statistics of the remote networks that are communicating with the specified system. The summary shows the busiest remote network for that system, the packet and byte rates, and connections for the busiest remote network as a percentage of the total for the system.
Example: IP Traffic for Remote Networks Seen by Monitored Stacks
The following example shows a partially expanded display.
The list enables you to identify remote IP addresses that have sent packets to or received packets from a mainframe stack since the Packet Analyzer was last started.
You can sort a list of remote addresses. For a remote address, you can view any available traffic statistics. You can also look up the host name of an address.
The following action is available in Remote Network:
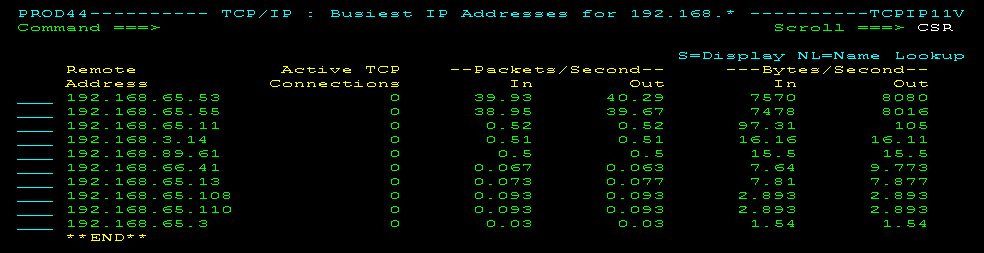
Lists the ten busiest addresses in a remote network for the past 5 minutes.
Example: Busiest Remote Addresses
You enter BI next to the 192.168.* remote network and list the ten busiest remote IP addresses.

IP Protocol summarizes the throughput by protocol for the specified system. The summary shows which protocols use most of the bandwidth. It shows the bytes in and out for each protocol as a percentage of the total for the system.
Example: IP Traffic for Monitored Stacks by Protocol
The following example shows a partially expanded display.
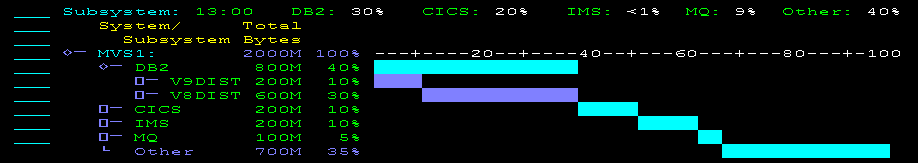
Subsystem provides visibility of the following IBM subsystems in the context of IP traffic:
The explorer shows the relative IP traffic in bytes for the subsystems and the constituent address spaces.
From the 3270 interface, you can expand a subsystem to its address spaces and you can expand an address space to the stacks it uses. You can also list associated connections and view the data samples.
Example: Explorer with DB2 Expanded
The following explorer display shows a DB2 subsystem with two address spaces:
You get a different view of the summaries when you sort them by stacks.