

This section includes the Daily Top 10 IDMS Programs by Region.
VIEW 1 of 3: IDMS Region Level: Top 10 Programs Executed
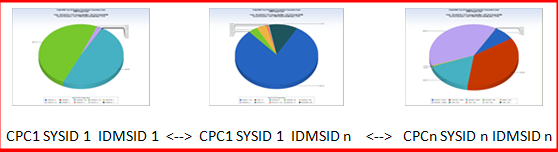
SUAPGM – Batch/CICS/DC Program Name
Note:
VIEW 2 of 3: IDMS Region Level: Top 10 Programs CPU Time
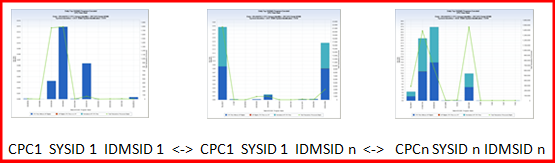
SUAXCSTM – CPU Time without zIIP Eligible
SUASUCTM – zIIP Eligible CPU Time on a CP
SUASPNTM – Normalized zIIP CPU Time
SUATTRAN – Total Transactions Processed
SUAPGM – Batch/CICS/DC Program Name
VIEW 3 of 3: IDMS Region Level: Top 10 Programs Response Time
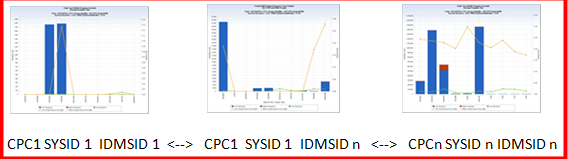
SUASTRAN – Short Transactions
SUAMTRAN – Medium Transactions
SUALTRAN – Long Transactions
SUAAVSTM – Short Average Response Time
SUAAVMTM – Medium Average Response Time
SUAPGM – Batch/CICS/DC Program Name
See the data extract described previously.
The charted information that is provided in this "by SYSID" level data extract is identical. The only difference is that charts are produced from data where information from multiple IDMS regions is aggregated to the SYSID level.
Therefore, instead of chart key values looking like this:
CPC1 SYSID 1 IDMSID 1 <--> CPC1 SYSID 1 IDMSID n <--> CPCn SYSID n IDMSID n
They will look like this:
CPC1 SYSID 1 <--> CPC1 SYSID 2 <--> CPCn SYSID n
|
Copyright © 2014 CA.
All rights reserved.
|
|