

Daily Total zAAP Demand by Service Class
ZAPENGT – Total zAAP Engine Demand Actual+Eligible
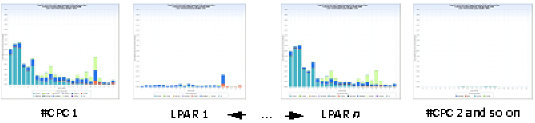
The vertical bars show total zAAP usage (zAAP actual+eligible CPU time) at the CPC level and for each PR/SM managed z/OS LPAR. For each CPC, the CPC level chart is produced first, with a SYSID value of ‘#CPC’, and is followed by the PR/SM managed z/OS LPARs for that CPC. The CPU times are divided by 3600 to convert from seconds to hours to create the chart variable ZAPENGT. Because one engine can be dispatched a maximum of one hour, per hour, this conversion allows the zAAP engine demand to be represented as physical engine hour equivalents. For example, two zAAP engines could, at full utilization, provide two hours of CPU time in one hour.
HOUR – Hour of Day
|
Copyright © 2014 CA.
All rights reserved.
|
|