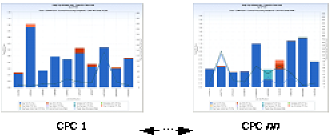
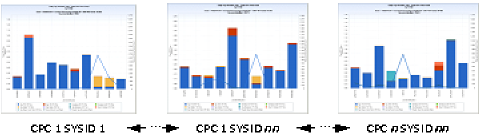
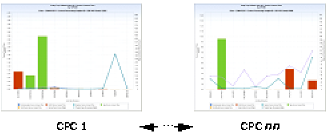
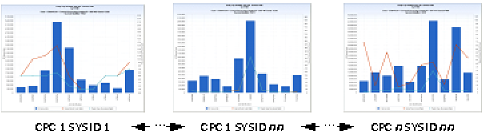
The SMFBJT query generates several chart sets. The chart sets show the daily top nn (default 10) batch jobs using CPU, I/O, and central storage (memory) resources on your z/OS systems. For each resource type, one chart set shows the top ten batch jobs using the resource over the entire Central Processing Complex (CPC), and another that shows the top ten batch jobs for each z/OS system. The query reads detail data from the BATPGM (Batch User Program Activity) file, and summarizes the data by job name. The charted data reflects summarized interval and step record information from all job steps for the top ten batch jobs.
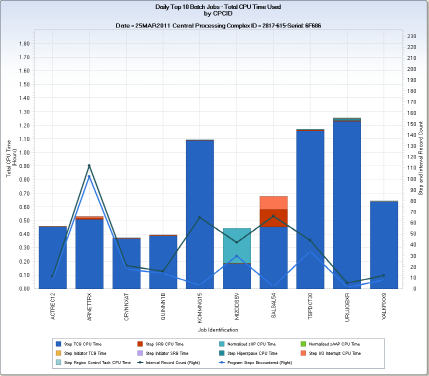
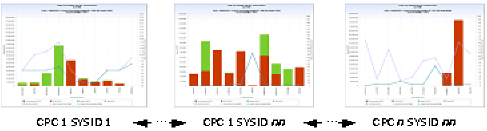
For CPU, the CPU time used by each of the top ten jobs is displayed using a vertical bar. The bar is segmented by CPU time type (for example, TCB, SRB, I/O Interrupt, zIIP, zAAP, and so on). Two horizontal lines show the program count (number of unique program executions) and interval count (number of interval records) encountered for the job. For short running steps, the interval count and program count values have similar values. For long running programs, the interval count exceeds the program count.
Note: The program count data element (PGMCOUNT) is only set to one (1) for the last interval record for a long running program. For jobs with a long running program step that has not yet ended, PGMCOUNT is zero.
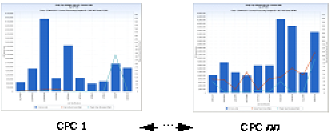
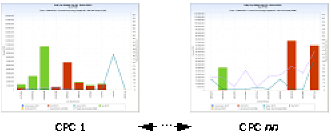
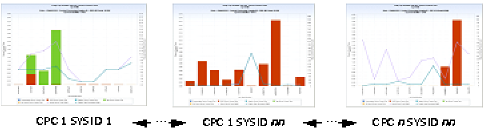
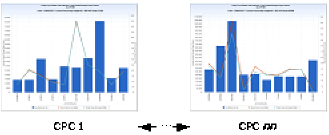
For I/O, I/O Service Units are used to determine the top ten jobs. Three different chart views are available to display I/O related resource utilization. The first view shows I/O service units for the top ten using vertical bars. The second view displays device connect time for the top 10 by device class (for example, DASD, TAPE, Unit Record, and so on). The device connect time is displayed using a vertical bar, with the bar segmented by the time connected to each of the device classes. The final view shows EXCPs by device class, again using a segmented vertical bar. As with the CPU chart, the program and interval record count are shown using a horizontal line.
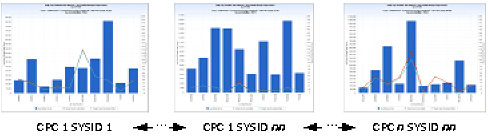
For central storage, the top ten jobs with the largest average working set size are displayed. Average working set size is the average number page frames in central storage used by the program. The page frame count is shown using a vertical bar and the program and interval record count are shown using a horizontal line.
Note: The average working set size represents the average for all step and interval records encountered for each top ten batch job. For this query, average working set size may be of limited value because many batch jobs contain several execution steps with dissimilar execution characteristics.
The example shows the CPC level chart generated for jobs executing on an IBM z/196 2817-615 CPC. The largest user of CPU time was the job ‘URUJOBXR’. The chart shows that for the day depicted, the job only had one step completion spanning five interval records, and consumed just over 1.2 hours of CPU time. Most of this time was Step TCB Time. Job ‘SALSAL54’ consumed significant SRB and I/O Interrupt CPU time, indicating significant I/O activity.
It is important to understand which applications are the biggest consumers of limited and expensive IT resources. This query shows the largest batch job consumers running on z/OS systems—at both the CPC and individual z/OS system level. Knowing not only the amount of resource consumed, but also the frequency of program execution, can help you to focus tuning efforts where potential payback is greatest. Tracking utilization by job name may or may not be useful at your installation—and is largely dependent on job naming standards.
SMF Daily Top 10 Batch Jobs CPU CPCID
PGMTCBTM – Step TCB CPU Time
PGMSRBTM – Step SRB CPU Time
PGMSPNTM – Normalized zIIP CPU Time
PGMZPNTM – Normalized zAAP CPU Time
PGMTCTM – Step Initiator TCB Time
PGMISRTM – Step Initiator SRB Time
PGMHIPTM – Step Hiperspace CPU Time
PGMIOITM – Step I/O Interrupt CPU Time
PGMRCTTM – Step Region Control Task CPU Time
PGMCOUNT – Program Steps Encountered
INTVLCNT – Interval Record Count
JOB – Job Identification
SMF Daily Top 10 Batch Jobs CPU SYSID
PGMTCBTM – Step TCB CPU Time
PGMSRBTM – Step SRB CPU Time
PGMSPNTM – Normalized zIIP CPU Time
PGMZPNTM – Normalized zAAP CPU Time
PGMTCTM – Step Initiator TCB Time
PGMISRTM – Step Initiator SRB Time
PGMHIPTM – Step Hiperspace CPU Time
PGMIOITM – Step I/O Interrupt CPU Time
PGMRCTTM – Step Region Control Task CPU Time
PGMCOUNT – Program Steps Encountered
INTVLCNT – Interval Record Count
JOB – Job Identification
SMF Daily Top 10 Batch Jobs IO CPCID
VIEW 1 – SMF Daily Top 10 Batch Jobs I/O – Service Units CPCID
PGMIOSU – I/O Service Units
PGMCOUNT – Program Steps Encountered
INTVLCNT – Interval Record Count
JOB – Job Identification
VIEW 2 – SMF Daily Top 10 Batch Jobs I/O – Connect Time CPCID
PGMCCOMM – Communication Device Connect Time
PGMCDASD – DASD Device Connect Time
PGMCGRAF – Graphics Device Connect Time
PGMCTAPE – Tape Device Connect Time
PGMCUREC – Unit Record Device Connect Time
PGMCOUNT – Program Steps Encountered
INTVLCNT – Interval Record Count
JOB – Job Identification
VIEW 3 – SMF Daily Top 10 Batch Jobs I/O – EXCPs CPCID
PGMCCOMM – Communication Device EXCPS
PGMCDASD – DASD Device EXCPS
PGMCGRAF – Graphics Device EXCPS
PGMCTAPE – Tape Device EXCPS
PGMCUREC – Unit Record Device EXCPS
PGMCOUNT – Program Steps Encountered
INTVLCNT – Interval Record Count
JOB – Job Identification
SMF Daily Top 10 Batch Jobs IO SYSID
VIEW 1 – SMF Daily Top 10 Batch Jobs I/O – Service Units SYSID
PGMIOSU – I/O Service Units
PGMCOUNT – Program Steps Encountered
INTVLCNT – Interval Record Count
JOB – Job Identification
VIEW 2 – SMF Daily Top 10 Batch Programs I/O – Connect Time SYSID
PGMCCOMM – Communication Device Connect Time
PGMCDASD – DASD Device Connect Time
PGMCGRAF – Graphics Device Connect Time
PGMCTAPE – Tape Device Connect Time
PGMCUREC – Unit Record Device Connect Time
PGMCOUNT – Program Steps Encountered
INTVLCNT – Interval Record Count
JOB – Job Identification
VIEW 3 – SMF Daily Top 10 Batch Programs I/O – EXCPs SYSID
PGMCCOMM – Communication Device EXCPS
PGMCDASD – DASD Device EXCPS
PGMCGRAF – Graphics Device EXCPS
PGMCTAPE – Tape Device EXCPS
PGMCUREC – Unit Record Device EXCPS
PGMCOUNT – Program Steps Encountered
INTVLCNT – Interval Record Count
JOB – Job Identification
SMF Daily Top 10 Batch Jobs Memory CPCID
PGMAVWSS – Avg Working Set Size
PGMCOUNT – Program Steps Encountered
INTVLCNT – Interval Record Count
JOB – Job Identification
SMF Daily Top 10 Batch Jobs Memory SYSID
PGMAVWSS – Avg Working Set Size
PGMCOUNT – Program Steps Encountered
INTVLCNT – Interval Record Count
JOB – Job Identification
DATEPART(ENDTS)
TRIM(LPCMOD)||'-'||TRIM(CPCMODID)||'-Serial: '||SUBSTR(CPCSEQNB,12,5);
SUM(PGMTCBTM,PGMSRBTM,PGMHIPTM,PGMRCTTM,PGMIOITM,
PGMSPNTM,PGMZPNTM,PGMISRTM,PGMITCTM) ;
INTVLCNT=1 ;
(uses existing data element PGMCOACT=1 in the initial input user code, then after summarization sets INTVLCNT=PGMCOACT to deal with Q&R default of treating Q&R derived elements as retained values in summarization).
The following modifications can be made to the SMFBJT query:
Note: This query charts two nonessential data elements: PGMITCTM and PGMISRTM (Initiator TCB and SRB time, respectively). If these data elements are not active in your step level files, the query fails to execute. To run the query, you can remove these two data elements from the ELEMENT SELECTION task in the two CPU time Data Extract steps. You can also ask your CA MICS administrator to activate these two elements in the step level files by changing the element definition in sharedprefix.MICS.GENLIB(SMFGENIN) from NAMX to NAME and then running the sharedprefix.MICS.CNTL(SMFCGEN) job. After these elements are activated, refresh the Q&R Meta Database.
| Copyright © 2011 CA. All rights reserved. | Email CA Technologies about this topic |