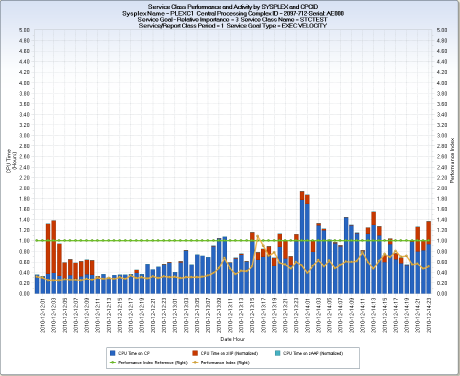
The RMFSRV query displays resource usage and performance indicators for z/OS Service Classes. As delivered, each chart shows the general processor CP, zIIP, and zAAP CPU time used by a Service Class Period. The CPU times used for each processor engine type are stacked and are scaled using the left Y-axis. Two lines are plotted against the right Y-axis scale—the performance index (PI) for the Service Class period, and a performance index "goal met" reference line, set to 1. As delivered, the RMFSRV query shows activity for the past three days activity. The X-axis displays DATE concatenated with HOUR. For each SYSPLEX, the Service Class Periods are presented in Relative Importance order, with the most important Service Classes presented first.
The chart heading information shows the Service Class Name, Relative Importance, Goal Type, and Service Class period charted. Three different data extract views are provided:
To prevent scaling issues, performance index values greater than 5 are set to 5. Performance index values between zero (0) and one (1) mean that the Service Class exceeded the specified performance goal. A value equal to 1 means that the goal was met exactly. Values greater than 1 means that the specified performance goal was not met. The performance index cannot be computed for certain goal types such as DISCRETIONARY and SYSTEM SPECIFIED.
The chart shows output at the SYSPLEX CPCID level. Shown is Period 1 for Service Class STCTEST running in SYSPLEX PLEXC1 on a 2097-712 CPC. The STCTEST Service Class has an execution velocity goal type. The actual performance index values (orange line) are consistently below 1, meaning that the actual performance experienced of workloads running in this Service Class routinely exceeds the specified goal. Workloads in this Service class use both CP and zIIP processor engines.
All workloads running on z/OS are assigned to a Service Class. Service Classes are defined with a level of importance. Most Service Classes are also assigned a goal type (for example, Execution Velocity, Response Time Percentile, and so on) and a performance goal to meet. The z/OS Workload Manager (WLM) manages physical resources (for example, CPU) and workload dispatching strategies to meet Service Class goals. Service classes with a higher relative importance value (0 high <--> 5 low) are given preferential treatment.
All three Q&R output views generated by the RMFSRV query are organized by SYSPLEX, and charts are produced for each Service Class Period. Each chart shows the CPU utilization and Performance Index (PI) for each HOUR. The PI indicates how well the workload performed against the designated goal.
In general, these charts provide the information required to understand the performance and resource consumption of z/OS workloads. Specifically, these charts can be used to track the performance of the Service Classes defined in your WLM Service Definitions and Policies. If a Service Class is routinely exceeding the assigned goal (for example, the PI is consistently 0.8 or lower), or missing the assigned goal (for example, the PI is consistently higher than 1), you can adjust the goal or change other workloads to free up additional resources for the troubled Service Class.
CPU time is the default resource usage metric plotted, but each Data Extract CSV provides a number of other performance metrics that can be alternatively selected for charting. These metrics include DASD Service time, paging rates, and average storage used.
Note: By design, SYSPLEXES can span Central Processing Complexes. If your SYSPLEXES do not span CPCs, then the first two data extracts are identical, with the exception that the second data extract, Service Class by SYSPLEX CPCID, identifies the CPC in each chart title. If your SYSPLEXES do span CPCs, then the Service Class by SYSPLEX CPCID data extract displays multiple charts for a Service Class that ran on multiple CPCs.
Service Class by SYSPLEX
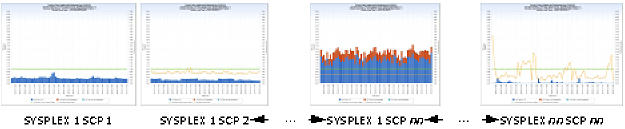
Note: SCP=Service Class Period
SECCPUTM – CPU Time on CP
SECSUPTM – CPU Time on zIIP (Normalized)
SECZAPTM – CPU Time on zAAP (Normalized)
SECPINDX – Performance Index
PINDXREF – Performance Index Reference (value set at 1)
HHMM – Hour : Minute
Data element HHMM is derived by concatenating the HOUR and MINUTE of each RMF interval together, separated by a colon, HH:MM (for example, 14:59 meaning hour 14, 59th minute).
Service Class by SYSPLEX CPCID
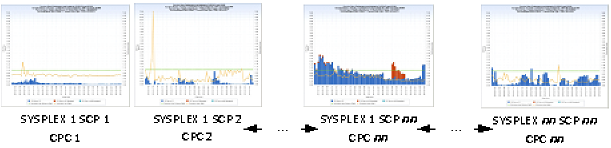
Note: SCP=Service Class Period
SECCPUTM – CPU Time on CP
SECSUPTM – CPU Time on zIIP (Normalized)
SECZAPTM – CPU Time on zAAP (Normalized)
SECPINDX – Performance Index
PINDXREF – Performance Index Reference (value set at 1)
HHMM – Hour : Minute
Data element HHMM is derived by concatenating the HOUR and MINUTE of each RMF interval together, separated by a colon, HH:MM (for example, 14:59 meaning hour 14, 59th minute).
Service Class by SYSPLEX CPCID SYSID
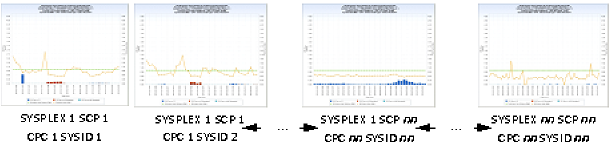
Note: SCP=Service Class Period
SECCPUTM – CPU Time on CP
SECSUPTM – CPU Time on zIIP (Normalized)
SECZAPTM – CPU Time on zAAP (Normalized)
SECPINDX – Performance Index
PINDXREF – Performance Index Reference (value set at 1)
HHMM – Hour : Minute
Data element HHMM is derived by concatenating the HOUR and MINUTE of each RMF interval together, separated by a colon, HH:MM (for example, 14:59 meaning hour 14, 59th minute).
TRIM(CPUMOD)||'-'||TRIM(CPCMODID)||'-Serial: '||SUBSTR(CPCSEQNB,12,5);
DATEPART(ENDTS);
PUT(HOUR(ENDTS),Z2.) || ':' || PUT(MINUTE(ENDTS),Z2.);
PUT(DATEPART(ENDTS),YYMMDDD10.) || ':' || PUT(HOUR,Z2.) ;
PUT(DATEPART(ENDTS),YYMMDDP10.) || '-' || HHMM ;
1 ;
The following modifications can be made to the RMFSRV query:
| Copyright © 2011 CA. All rights reserved. | Email CA Technologies about this topic |