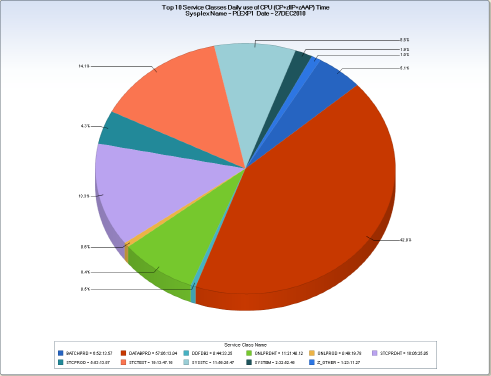
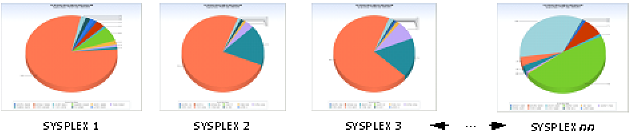
The RMFSVT query displays several pie charts showing a daily view of the top ten Service Class users of several important resources—CPU, I/O, and Central Storage. For the CPU usage pie chart, CP, zIIP, and zAAP CPU times are aggregated into a single metric. The metric shows total CPU utilization across all engine types.
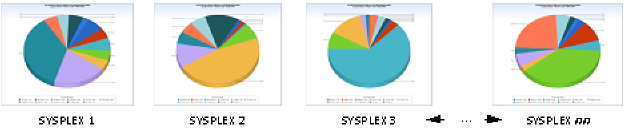
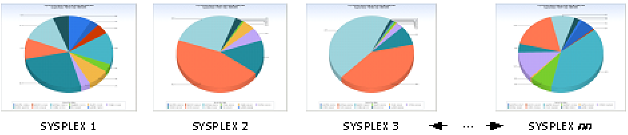
The chart heading information shows the SYSPLEX Name, DATE, and resource unit (CPU, I/O, or Central Storage) charted. Three different data extract views are provided, each one showing the top ten users of a resource. An artificial 11th Service Class, Z_OTHER, is created and used to display the aggregated resource use for the remaining (11th through nth) Service Classes.
Note: If you want to see the top nn resource users, where nn is a number other than 10, see the Modifications documentation.
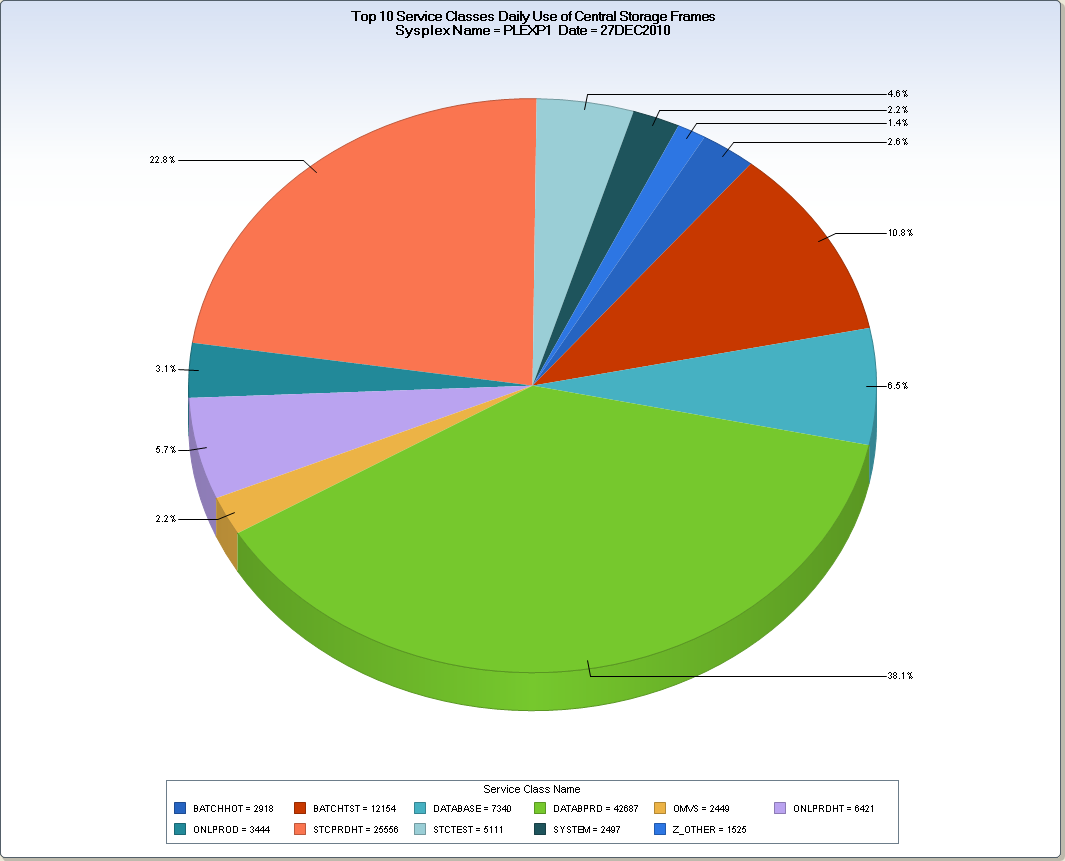
The first chart shows the top ten Service Classes consuming CPU time for the day in SYSPLEX PLEXP1. The second chart shows the top ten Service Class highest average consumers of central storage page frames.
The pie charts generated by the RMFSVT query provide a good way to identify quickly the Service Classes that dominate resource utilization across your WLM SYSPLEXES. Identifying these high use resource consumers allows you to focus performance improvement efforts where they provide the greatest return.
zOS Daily Top 10 Service Class Storage
SECAVCRS – Average Storage Used – CS
zOS Daily Top 10 Service Class CPU Time
TOTCPU – Total CP zIIP and zAAP CPU Time
Note: TOTCPU is the sum of CP, Normalized zIIP, and Normalized zAAP CPU Times
zOS Daily Top 10 Service Class IO SUs
SECTOIOC – I/O Service Units
TRIM(CPUMOD)||'-'||TRIM(CPCMODID)||'-Serial: '||SUBSTR(CPCSEQNB,12,5);
DATEPART(ENDTS);
TOTCPU = SUM(SECTCPTM,SECZAPTM,SECSUPTM) ;
TOPNN = 10 ;
The following modifications can be made to the RMFSVT query:
| Copyright © 2011 CA. All rights reserved. | Email CA Technologies about this topic |