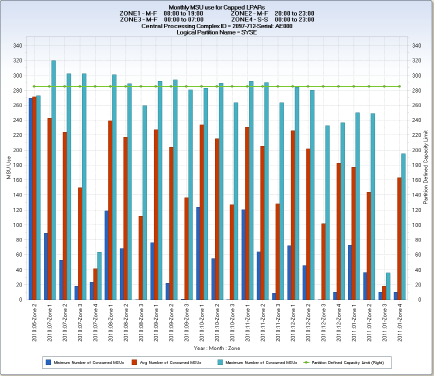
The RMFMMC query shows the monthly z/OS LPAR MSU use at the ZONE (Time Zone) level. All z/OS LPARs are accounted for. For each ZONE within each month, three vertical bars show the minimum, average, and maximum MSU use in the time range. The query generates two separate data extracts. One for z/OS LPARs that have defined capacity limits, and the other for z/OS LPARs with no defined capacity limits. One of the uncapped LPARs for each CPC is the ‘PHYSICAL’ LPAR that captures PR/SM overhead.
The example shows the minimum, average, and maximum MSU usage chart for a z/OS LPAR (PRSMLPNM=’SYSE’) running on an IBM z/10 2097-712 CPC. Four ZONES have been defined to CA MICS. The title of the chart is manually customized using the Q&R View Edit facilities to specify the day and time ranges associated with each ZONE.
The processing capacity of mainframe CPCs is expressed in MSUs (Millions of Service Units per Hour). One of the characteristics of a specific CPC model is its MSU capacity. This capacity is indicative of its workload processing capability and is directly related to the number of general-purpose CP engines configured. Each LPAR that is assigned logical CP processors uses some amount of the available CPC MSUs. The MSU capacity of a CPC and of individual LPARs can influence the cost of software licensed to run on LPARs. Some software licensing costs can be lowered by defining a capacity limit for an LPAR. The limit prevents the LPAR from using the full MSU capacity associated with the logical processors assigned to it. The RMFMMC charts are useful for visualizing longer term resource usage trends for your z/OS LPARs. The average MSU usage bar is the most important. The MIN and MAX represent singular extremes, while the average MSU use is the average of all RMF intervals over each time period charted,
Monthly MSU Use for Capped LPARs
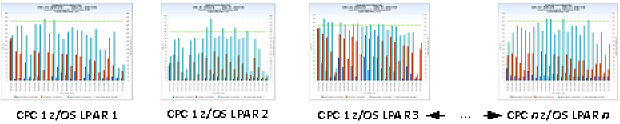
All LPARs in this data extract have defined capacity limits. If no LPARs in any CPCs have defined capacity limits, a single chart is produced with a CPCID of ‘NO Capped LPARS’ and an LPAR name of ‘NADA.’
LPCMNMSU – Avg Number of Consumed MSUs
LPCUAVMSU – Avg Number of Consumed MSUs
LPCMXMSU – Avg Number of Consumed MSUs
LPCDEFLM – Partition Defined Capacity Limit
YYYYMMZZ – Year : Month : Zone
Data element YYYYMMZZ is derived by concatenating the 4-digit year, colon ":", and 2-digit month, with the literal "–Zone ", and the 1-digit ZONE value (for example, 2010:08-Zone 1).
Monthly MSU Use for Uncapped LPARs
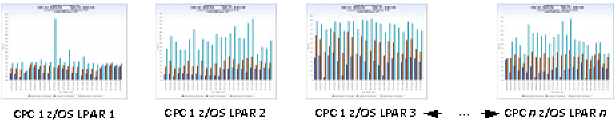
All LPARs in this data extract have no defined capacity limits. There is always at least one LPAR in this data extract for each CPC—the ‘PHYSICAL’ LPAR which shows PR/SM overhead.
LPCMNMSU – Avg Number of Consumed MSUs
LPCUAVMSU – Avg Number of Consumed MSUs
LPCMXMSU – Avg Number of Consumed MSUs
HHMM – Hour : Minute
Data element YYYYMMZZ is derived by concatenating the 4-digit year, colon ":", and 2-digit month, with the literal "–Zone ", and the 1-digit ZONE value (for example: 2010:08-Zone 1).
TRIM(LPCMOD)||'-'||TRIM(CPCMODID)||'-Serial: '||SUBSTR(CPCSEQNB,12,5);
PUT(YEAR4,Z4.) || ':' || PUT(MONTH,Z2.) || '-Zone ' || SUBSTR(ZONE,1,1) ;
The following modifications can be made to the RMFMMC query:
Important! Modify the chart titles, using the Q&R View Edit facility to change the ZONE definitions if they differ from the days/hours specified in the sample query.
| Copyright © 2011 CA. All rights reserved. | Email CA Technologies about this topic |