

|
|
|
The Job Monitor window lets you monitor a job’s resource usage based on its historical minimum, average, and maximum usage. To display the Job Monitor window, select a job and choose Monitor... from the Jobs menu. You can shrink this window to an icon. The following figure shows the Job Monitor window:
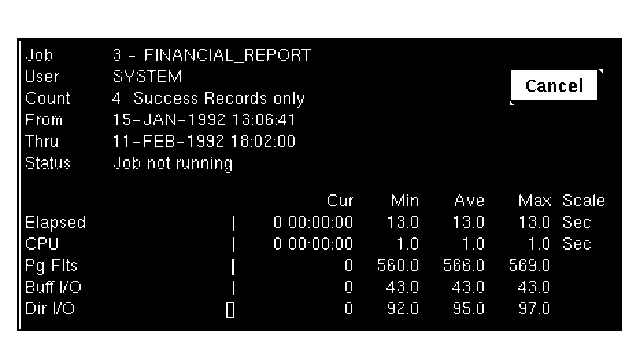
The top half of the Job Monitor window lists job information such as the job name and number, user name, success count, and status. On the bottom-left are histograms that graphically display the resource usage of the job. For each job running in the Display window, you can monitor the current resource usage of the following:
On the bottom-right of the window are the actual numbers associated with the histograms.
The rectangle outlines next to each resource indicate the historical usage. The left side of each rectangle represents the minimum usage, the right side represents the maximum usage. When information is within a narrow range, a thin or thick line is displayed instead of a rectangle.
The right sides of the rectangles are positioned relative to the maximum usage of each resource. Therefore, when a job is not running, all rectangles will be even on the right side.
| Copyright © 2012 CA. All rights reserved. | Tell Technical Publications how we can improve this information |