

To get started with the Application Monitor, follow the steps described below.
Step 1
To request the Application Monitor, type pmam following the ENTER NEXT TASK CODE prompt:
V71  ENTER NEXT TASK CODE:
 pmam
Step 2
Press [Enter]. The Application Monitor displays the menu screen which lists all of the Application Monitor options.
 PM-Rnn.n SYSTEM71         CA, Inc.                  V71      08.348 08:07:24.19
 CMD-->                                                             Window : 01

   01 Application Monitor Menu

   PFkey  Description                      PFkey  Description
 _  PF1   Entity List                    _  PF2   Task List
 _  PF3   Entity Selection               _  PF4   General Statistics
 _  PF5   DC Statistics                  _  PF6   DB Statistics
 _  PF7   ADS Statistics                 _  PF8   Task Wait Statistics
 _  PF9   DBkey Wait Statistics          _  PF10  PMAM Status/Options
 _  PF11  SQL Statistics


  Application Monitor is Online and Collecting Data
Monitor Screens
The following table summarizes the Application Monitor screens. Each screen is described in more detail later in this chapter.
|
Screen |
PF Key |
Displays |
|---|---|---|
|
Application Monitor Menu |
|
A menu of Application Monitor screens |
|
Entity List |
PF1 |
The entities currently defined to the monitor; from this list, you can:
|
|
Task List |
PF2 |
A list of tasks associated with a particular entity and for which the monitor has collected statistics; you can select or delete a task from the list |
|
Entity Selection |
PF3 |
Prompts that let you define an entity to be monitored |
|
General Statistics |
PF4 |
General statistics about the task |
|
DC Statistics |
PF5 |
Detailed DC/UCF system statistics for a specified task |
|
DB Statistics |
PF6 |
Detailed database access statistics for a specified task |
|
ADS Statistics |
PF7 |
CA ADS runtime statistics for an entity occurrence |
|
Task Wait Statistics |
PF8 |
Detailed wait statistics for a specified task |
|
DBkey Wait Statistics |
PF9 |
Information on database keys for which the task waited |
|
PMAM Status/Options |
PF10 |
Options specified by the system administrator |
|
SQL Statistics |
PF11 |
Detailed SQL statistics for a specified task. |
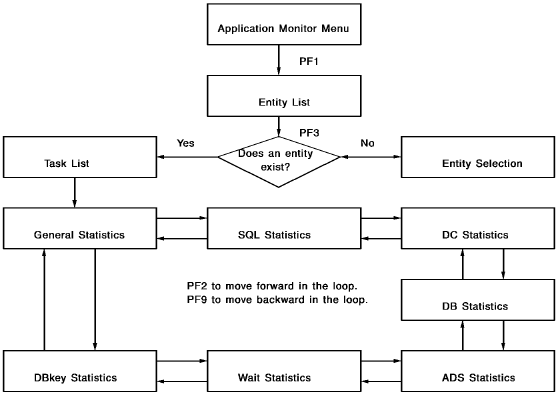
Screen Flow
Application Monitor screens can be used hierarchically. Typically, you initiate a session with the Application Monitor by following these steps:
The following illustration shows the sequence of screens.
Current Entity
The current entity is the first entity on the Entity List screen.
Note: For more information about making another entity current or deleting an entity, see Entity List (PF1).
Current Task
The current task is the first task on the Task List screen. All of the tasks on any given Task List screen are the tasks associated with the current entity.
Skipping the Entity List and Task List Screens
If, instead of choosing an entity, you press [PF2] to go directly to the Task List screen, the Application Monitor lists the current entity.
If, instead of choosing an entity and task, you press a PF key to go directly to a statistics screen, the Application Monitor provides statistics for the current task of the current entity.
|
Copyright © 2014 CA.
All rights reserved.
|
|