

You can access the project dashboard report by right clicking any selected project from the Explorer view and by selecting the Reports, Project Dashboard. You can generate a set of project dashboard reports:
Configured Dashboard Reports
Configure the project dashboard to generate various reports.
Follow these steps:
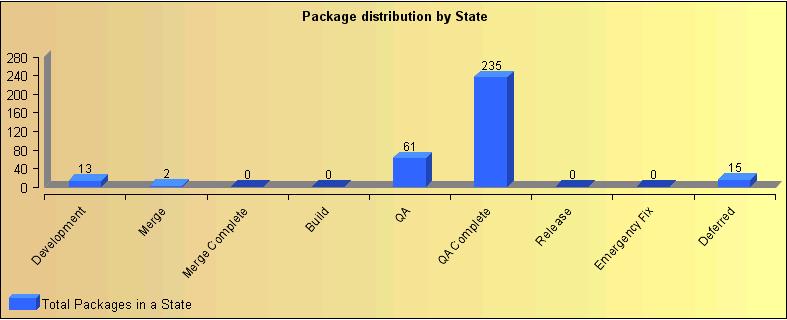
Displays the count of package distribution across the states in the selected project.
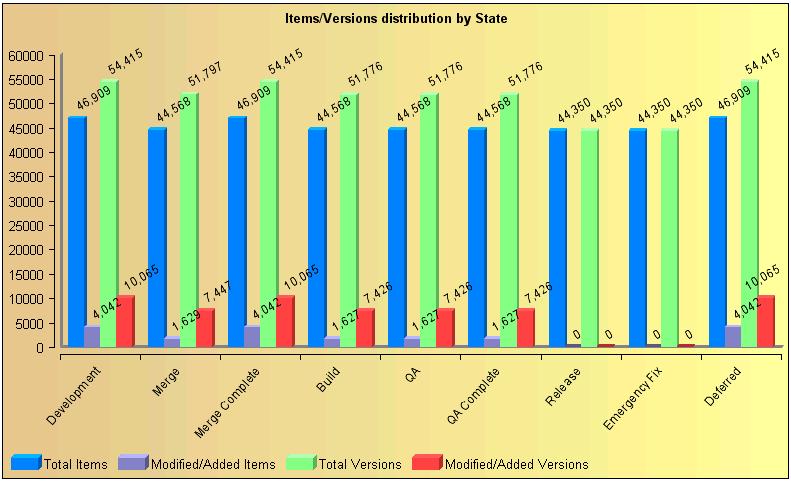
Displays the details about the total items, modified items, total versions, and modified versions in the selected project.
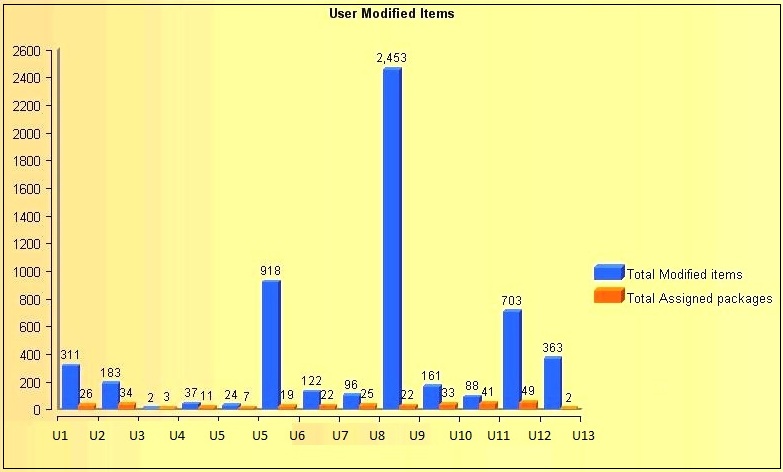
Displays the total modified items and the total assigned packages for all the users in the selected project.
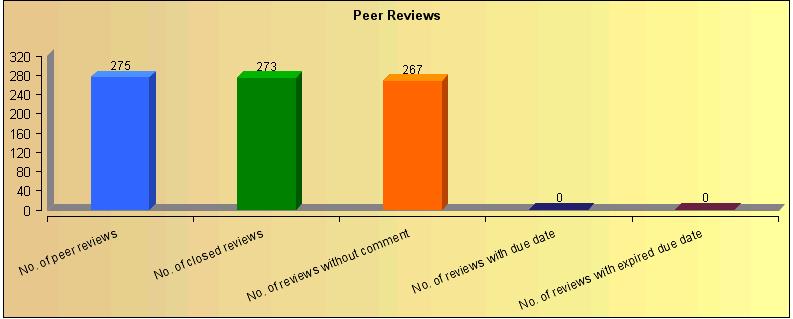
Displays the code review requests summary for the chosen project.
Provides the origination information about the baseline repository.
For Example: A sample report shows the following project origination information:
Now if you report on ProjectC, the origination information about RepA and RepB appears.
In this example, the report shows ProjectC’s RepA is derived from ProjectB’s SS2 and RepA is originated from ProjectA’s SS1.
Displays all versions which are merged from other projects to the current selected project.
Displays the frequency of the changes for a specified state and duration.
Displays information about the logged in users in the current session.
The configurations are saved to generate the report.
The package distribution by state report shows the number of packages that exist in each state at the current time. This report helps you to estimate the packages that are required to be completed before being promoted to the next state. You can generate a bar chart for this report with the State names on X-axis and the Package count on the Y-axis.
The following graph illustrates a sample package distribution report. This report displays the total packages that are created in each state by the users that are logged in at a given time.
The item/versions distribution by state chart displays the following information for each state in the selected project:
The following graph illustrates a sample item/versions distribution by state report displaying information in a selected project.
The user modified items report displays the total number of modified items by each user in the project and the number of working packages.
The following graph illustrates a sample user modified items report that displays total modified items against total assigned packages.
The peer review report displays the following peer reviews information in the form of a bar chart:
The following graph illustrates a sample peer review report.
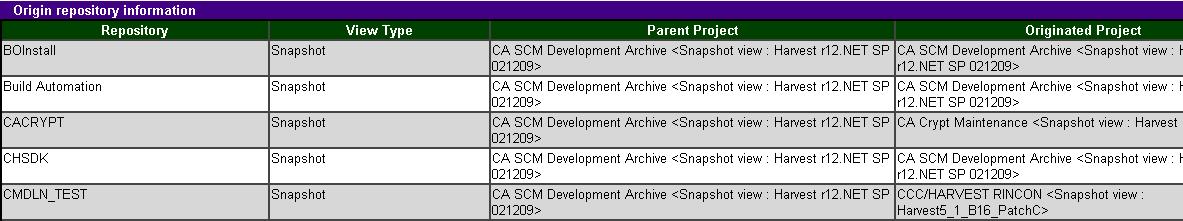
The origination repositories report provides origination information about the baseline repository in a tabular form.
Example:
A sample report shows the following project origination information:
Now if you report on ProjectC, the origination information about RepA and RepB appears.
In this example, the report shows ProjectC’s RepA is derived from ProjectB’s SS2 and RepA is originated from ProjectA’s SS1.
The following table displays a sample origination repositories information.
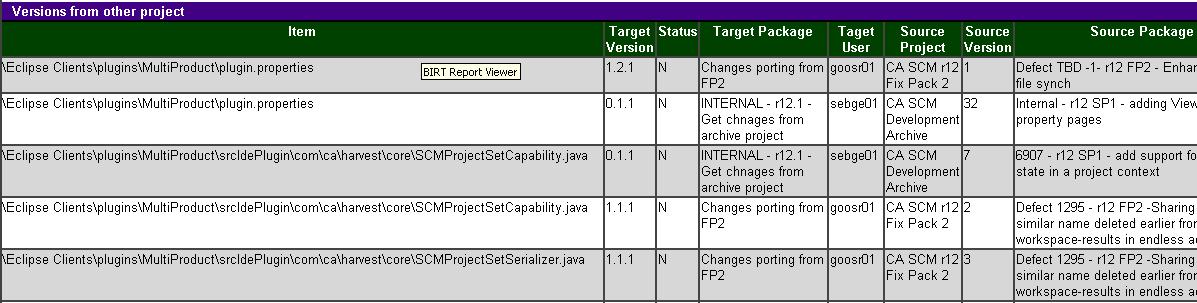
The Versions from Other Projects report displays all versions which are merged from other projects to the current selected project.
The following table displays a sample version from other project report.
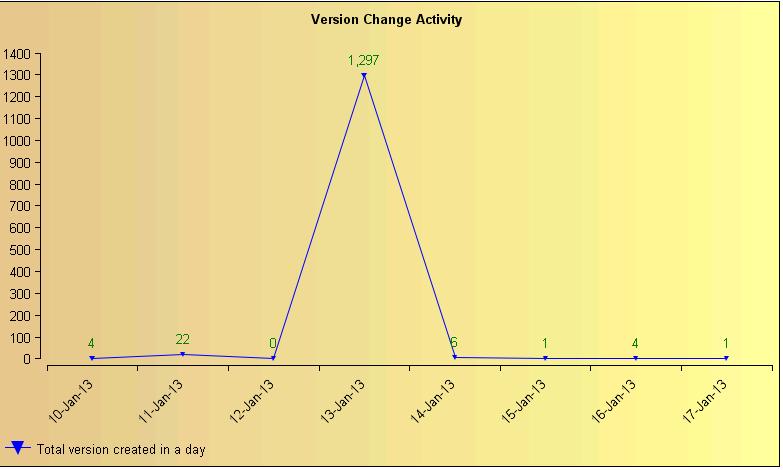
Version change activity report displays the graph on the frequency of the changes that are made to the SCM Repository over a period. This graph indicates time on X-axis and count of versions on the Y-axis.
Note: Depending on your access permissions, you can customize and generate the report that is based on the frequency of changes.
As a developer, you can generate the report that is based on the frequency of changes that you made. As a manager, you can generate the report that is based on the frequency of changes that the development team made.
The following graph illustrates a sample version change activity report that displays the total versions that are created at a given time.
|
Copyright © 2015 CA Technologies.
All rights reserved.
|
|