

Construction and Test › Testing the Application › Application Test
Application Test
CA Gen provides an interactive Diagram Trace Utility to assist with debugging an application. It lets you follow the execution of statements in the action diagram and examine and dynamically change the contents of views and system attributes. To use the Diagram Trace Utility, the application (or parts of the application) must have been generated with trace. The application should be regenerated without trace prior to deployment to a production environment.
When using the Diagram Trace Utility within a Windows environment, you are presented with the default perspective (window layout) as shown below.
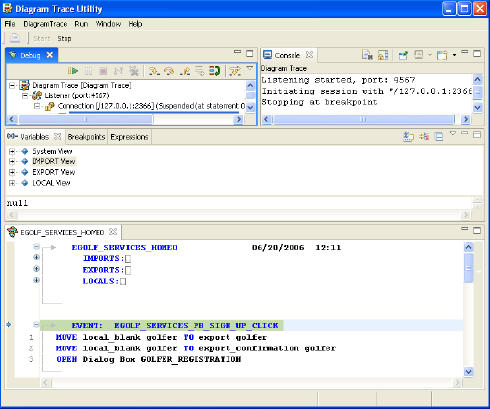
The default perspective is split into five views (Debug view, Console view, Variables view, Breakpoints view, and Expressions view) and a PAD Code View editor which shows the action diagram being traced.
- The Debug view shows that the Diagram Trace Utility is started and listening on the configured port (in this case, the default port 4567).
- The Console view is a read-only view that displays standard output messages.
- The Variables view displays the system variables and import, export, local, and entity action view data.
- For information on the Breakpoints and Expressions views, see the Diagram Trace Utility User Guide.
- The PAD Code View editor is a read-only viewer that lets you view the action diagram statements as they are being executed. You can step through one or more statements of the action diagram at a time by clicking one of the icons from the Debug toolbar. The highlighted statement is the statement that will be executed on the next step through the action diagram. In other words, the highlighted statement has not yet been executed.
Copyright © 2013 CA.
All rights reserved.
|
|