

In the Expressions view, you can view the current evaluated state of expressions that you previously entered.
The Expressions view opens automatically when you add a Watch expression to the view. You can inspect data in the Expressions view when the trace execution is suspended.
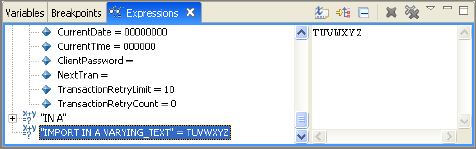
There are two split view panes displayed by default in the Expression view, the Expression pane and the Detail pane. The Expression pane contains the entered or copied expression to be evaluated. The Detail pane displays the values resulting from the highlighted expression or expressions that are being evaluated.
When the Detail pane is displayed, you can click the slider bar that exists between the two areas and move it to adjust the size of each pane.
|
Copyright © 2013 CA.
All rights reserved.
|
|