

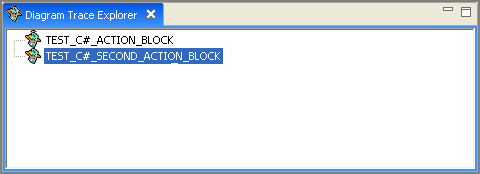
The Diagram Trace Explorer view displays a hierarchical view of the source code for PADs that are cached in the Diagram Trace Utility workbench.
The illustration shows two cached Actions Diagrams that are available for inspection. You can right-click and select Open from the pop-up menu to open the available source (.pad) files inside of a PAD Code View editor.
During the debug session, the application sends its PAD code to the Diagram Trace Utility. The Diagram Trace Utility stores the received data in XML format in .pad files in the Diagram Trace Utility's workspace subdirectory. The utility saves these files from one debug session to another and lets you access these .pad files.
|
Copyright © 2013 CA.
All rights reserved.
|
|