

Analyzing Interactions › Analyzing Entity Type Life-Cycles › Entity Life-Cycle Diagram
Entity Life-Cycle Diagram
The purpose of an Entity Life-Cycle Diagram, sometimes named the Entity State Transition Diagram, is to depict entity states and the possible state changes for entities of a single type.
When using CA Gen, you have defined a life-cycle partitioning that includes entity subtypes for each of the discrete states in the life-cycle. CA Gen uses the "fence post" style of diagram as shown in the following illustration.
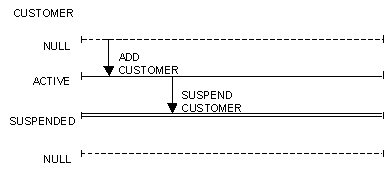
This diagram uses the following symbols:
- A horizontal bar represents each state.
- Entity states are grouped in a partitioning with vertical brackets.
- A vertical arrow represents an elementary process that can cause an entity in one state to move to a destination state.
- Null states are depicted as broken bars.
- A double horizontal bar distinguishes the termination state.
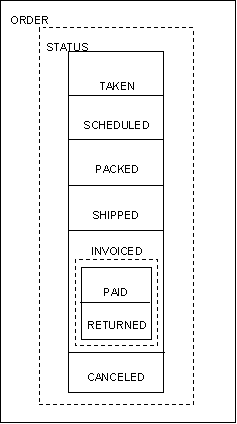
The Entity Relationship Diagram fragment in the following illustration presents a complex life-cycle partitioning of the entity type Order with two life-cycle partitionings and nine discrete entity states.
The entity life-cycle depicts the life-cycle by showing the possible movement of an entity between states. Consider the following illustration of the entity life-cycle for the entity type Order.
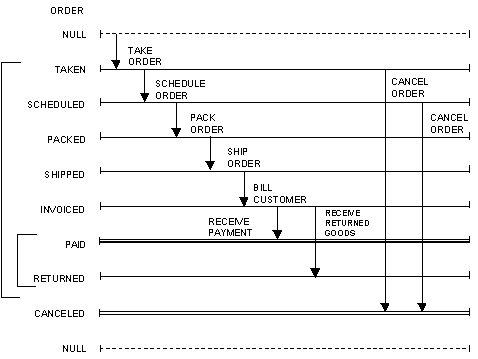
Each state in this illustration corresponds to a subtype in the life-cycle partitioning that is depicted in the previous illustration of the life-cycle partitioning of the entity type Order.
Vertical brackets group together the states that are common to a life-cycle partitioning. All the names appearing on the vertical arrows are those of elementary processes in the Activity Hierarchy Diagram.
Notes:
- There is one creation state: Taken.
- The elementary process Take Order moves an order from the null state to the Taken state. Any horizontal bar that is the target of an arrow leading from the null state is a creation state.
- There are four possible termination states:
- Null state
- Paid
- Canceled
- Returned
- The null state at the bottom of the diagram is always a termination state because this implies deletion of the entity (the ultimate in termination).
- The other three are easily recognizable as termination states because no vertical arrows come from them. Hence, no changes of entity state are possible once any of those states is entered.
- The horizontal bars from which arrows emerge constrain the processes that are represented by those arrows.
- For example, Cancel Order only be executed against orders in either the Taken or Scheduled state. An order that is Packed may not be operated upon by Cancel Order.
- There are two vertical brackets representing the Status partitioning, and a smaller group of the two possible states of Invoiced Orders, Paid or Returned.
- The Entity Life-cycle Diagram shows processes only from the viewpoint of the entity type under consideration.
- For example, the process Bill Customer is likely to create an entity of type invoice, and change the state of an entity of type order from Shipped to Invoiced. Since this diagram relates only to order, invoice is not shown.
- The null state is omitted from the life-cycle partitioning on the Entity Relationship Diagram, but it does appear on the Entity Life-Cycle Diagram.
Copyright © 2014 CA.
All rights reserved.
|
|