
A Dependency Diagram can be drawn for any process in the analysis model except for elementary processes because elementary processes do not have any children to be depicted on a Dependency Diagram.
For a complex activity hierarchy, dependency analysis can be performed level by level, in parallel with successive decomposition of the activities.
In the hierarchy that is shown in the illustration, Function A is divided into B and E. The Dependency Diagram of Function A is then drawn showing the interactions of B and E. This helps to identify the processes C and D, and F and G.
Next, a Dependency Diagram is drawn for B. This diagram shows C and D. Another diagram is drawn for E, showing F and G. Each of these last two diagrams takes into account the dependencies that are already identified when drawing the diagram for A. Drawing these diagrams suggest, in turn, that dependencies be added to B and E.
CA Gen Activity Dependency and Hierarchy Diagramming Tools together support this approach, because it is possible to add activities to the model using either diagram.
Consider the function Inventory Management. Replenish Stock is performed whenever the "stock is low" condition occurs. This condition can occur as a result of any of the processes Issue Stock, Destroy Stock, Check Stock Level, and can Establish Stock Level Policy. In a large hierarchy, it is unlikely that these processes would all be part of the same parent activity, so that they all appear together on one Dependency Diagram. The business performs a regular Check Stock Level process that recognizes "stock is low," which is a sibling of Replenish Stock and can therefore be shown as dependent on Check Stock Level. The precondition "stock is low" can be added to the definition of Replenish Stock. This condition can also be modeled as an event; an event consequence diagram can then show all dependencies that are associated with the event. See the chapter "Event Analysis" for more information.
Dependency analysis tends to be time-consuming. For tightly scoped projects that call for rapid development, you think about dependencies for all processes but decide to draw dependency diagrams only for parents of elementary processes. When the Check command is performed on the model, warning messages appear for activities that have no dependencies. These warnings are ignored.
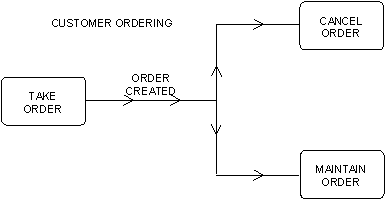
The previous illustration of a corrected activity hierarchy diagram shows two Dependency Diagrams, one for Customer Ordering and one for Amend Order. The Customer Ordering diagram in the following illustration depicts the interdependency between the two elementary processes Take Order and Cancel Order, and Amend Order, their non-elementary sibling.

The Amend Order diagram (not shown here) depicts the interdependency between the elementary processes Amend Order Header and Amend Order Item.
|
Copyright © 2014 CA.
All rights reserved.
|
|