

Follow these steps:
When you access CA Executive Insight on your mobile device, you can view all business indicators from the CA SOI connector like any other business indicator.
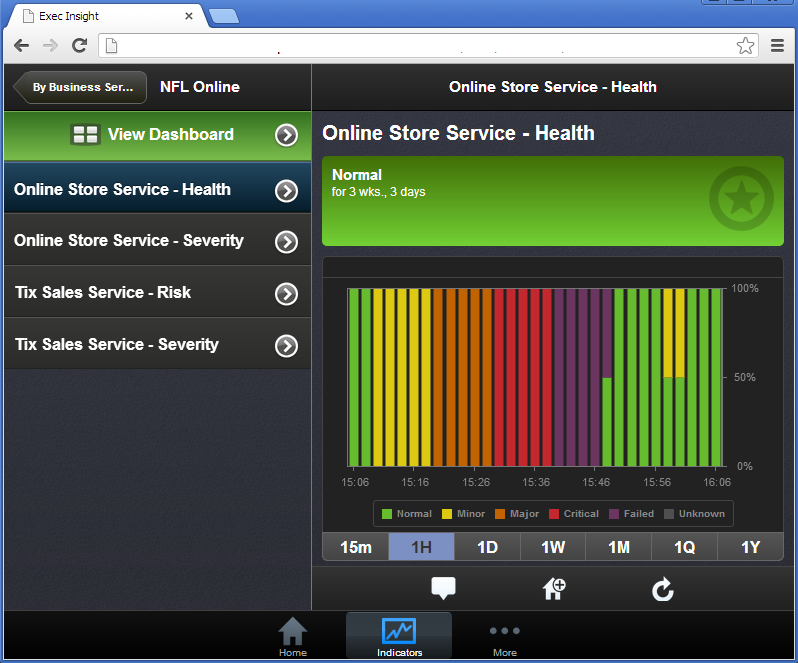
Notice that you can select tabs at the bottom to view different time intervals, such as: 15 minutes, 1 hour, 1 day, 1 week, 1 month, 1 quarter, and 1 year.
|
Time Button Selected |
Each Bar Equals This Amount of Minutes |
|---|---|
|
15m (15 minutes) |
1 minute |
|
1H (1 hour) |
2 minutes |
|
1D (1 day) |
60 minutes |
|
1W (1 week) |
360 minutes |
|
1M (1 month) |
1440 minutes |
|
1Q (1 quarter) |
4320 minutes |
|
1Y (1 year) |
21600 minutes |
|
Copyright © 2013 CA.
All rights reserved.
|
|