Previous Topic: Example: Create an Alert for a Self-Monitoring Event

Next Topic: Configure Action Alert Retention

Example: Email the Administrator when Event Flow Stops

Administrators need to be notified when any connector on any agent stops collecting events. You can automate this notification when an indicator suggests that this has occurred. You can configure the indicator, which is the elapsed time since a collection server has received events from any connector. You can set the elapsed time to the desired number of minutes, hours, or days. You can extend the query to all collection servers in the federation.

To limit the number of emails sent when a connector goes down, consider only those connectors that have been collecting events up until now. For example, set the alert to return rows only for connectors that did collect events during the hour before this one but did not collect events during the last hour.

To capture this data, select the predefined query, Collection Monitor by Log Manager Agent Connector Down. This query returns the connector name and the agent name when no events are received as defined in Result Conditions in the alert. Use the following example as a guide to generate an alert when no events are received during the last hour from a connector that sent events during the period between one and two hours ago. For the alert destination, specify the email address of the individual to notify. For the schedule to run the query, specify a frequency greater or equal to that of the elapsed time period.

Note: Email Settings must be configured under Administration, Report Server before creating the alert.

To email the Administrator when a connector stops collecting events

  1. Select the server from which to run this alert. In a hub and spoke architecture, select a collection server to capture the condition as soon as possible.
  2. Select the Alert Management tab and the Alert Scheduling subtab.
  3. Click Schedule an Action Alert.
  4. Enter a job name, for example, Connector Down.
  5. Select from Available Queries, Collection Monitor by Log Manager Agent Connector Down and move it to the Selected Queries list.

    Select the query Collection Monitor by Log Manager Agent Connector Down.

  6. Click Result Conditions.
  7. Set the time for the last 2 hours.
    1. Select the Predefined Ranges: Last hour.

      This sets the dynamic end time correctly to 'now', '-2 minutes'
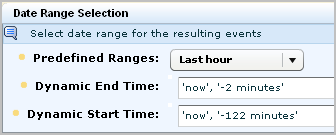
    2. Click Edit dynamic time string for Dynamic Start Time.
    3. For Dynamic Time String, replace 62 with 122.
    4. Click OK.

    Edit the ranges to show 'now','-1 minutes' for dynamic end time and 'nwo', '-121 minutes' for dynamic start time.

  8. Set Result Conditions.
    1. Select Latest grouped event data before and click Edit
    2. Select Now for Reference time and click Add reference time to Dynamic Time string
    3. Click down once on the spinner for Shift time to display -1, select hour from the drop-down list, and click Add time shift to Dynamic Time string.
    4. Click OK.

    Latest grouped event dated before 'now', '-1 hours'

  9. Click the Schedule Jobs step and define the recurrence interval. For example, set the interval for 1 hour.

    Select 1 for recurrence interval and hours for the unit of measure.

  10. Click Destination and complete the E-mail tab.
    1. Select Enable e-mail notification.
    2. Enter the administrator's email address for Email To.
    3. Enter your email address for Email From.
    4. Enter the subject in the Subject field. For example, type Connector may be down.
    5. Enter email text. For example, type: Connector stopped sending events within the last hour.
  11. Click the Server Selection step and clear Federated if desired.
  12. Click Save and Close.

You could define this alert to query for the date range in days, rather than hours, and then schedule it to run once a day. In this case dynamic end time would be set to 'now', dynamic start time would be set to 'now', '-2 days', and latest grouped event dated before would be set to 'now', '-1 days'.

More information:

Example: Federation Map for a Mid-Sized Enterprise