

New Feature Guided Tours
New Feature Guided Tours
Review the following guided tours to become more familiar with the new features of this release.
This section contains the following topics:
Objective of Guided Tours
Use Case 1
Use Case 2
Use Case 3
Use Case 4
Objective of Guided Tours
The objective of the Guided Tours section is to introduce the basic functions of CA ERwin Report Designer to users. This section contains four use cases that demonstrate the behavior of report template designer, report explorer, report results grid, and basic HTML export.
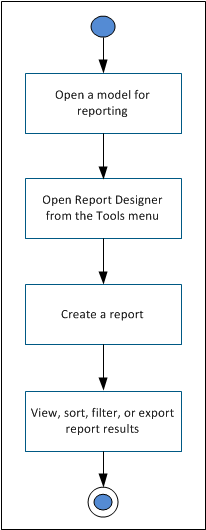
In general, all the use cases have the following steps:
Use Case 1
Description: Design a basic report with the logical and physical names of entities and then view the results in the Report Designer results grid.
Follow these steps:
- Open a model for reporting.
- Click Tools, Report Designer.
- Click Create a report on the toolbar. The Report Editor dialog appears.
- Enter a name for the report.
- Select Logical/Physical as the report type.
- Select Entity/Table in the Select Report Subject pane.
- In the Select Report Fields pane, expand the Properties node under Entity, and select Name and Physical Name.
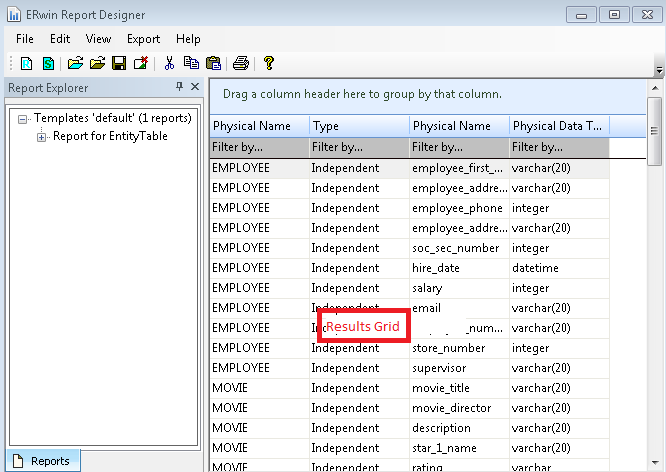
- Click Run Report.
The report is displayed in the result grid, as shown in the following diagram:
Use Case 2
Description: Design a report with logical name and definition of entities and attributes. View the results in the results grid.
Follow these steps:
- Open a model for reporting.
- Click Tools, Report Designer.
- Click Create a report on the toolbar. The Report Editor dialog appears.
- Enter a name for the report.
- Select Logical as the report type.
- Select Entity in the Select Report Subject pane.
- In the Select Report Fields pane, expand the Properties node under Entity, and select Name and Definition.
- Similarly, expand Attribute, Properties, and select Name and Definition.
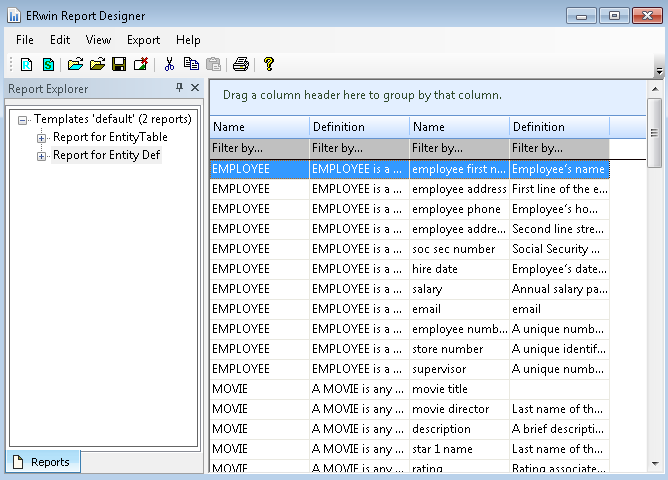
- Click Run Report.
The report is displayed in the result grid, as shown in the following diagram:
Use Case 3
Description: Design a report with physical name of entities and physical name and domain name of the corresponding attributes. View the results in the results grid. Sort the rows based on domain name to understand which attributes share the same data domain.
Follow these steps:
- Open a model for reporting.
- Click Tools, Report Designer.
- Click Create a report on the toolbar. The Report Editor dialog appears.
- Enter a name for the report.
- Select Physical as the report type.
- Select Table from the Select Report Subject pane.
- In the Select Report Fields pane, expand the Properties node under Table, and select Physical Name.
- Similarly, expand Column, Properties, and select Physical Name. Under Column, expand Parent Domain, Domain, Properties, and select Physical Name.
- Click Run Report.
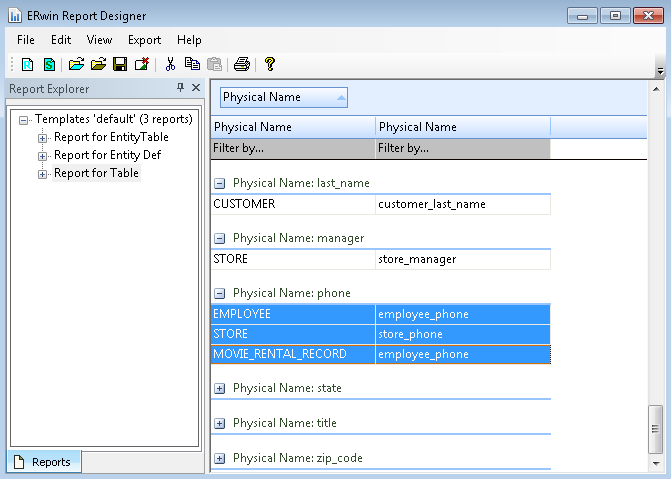
The report is displayed in the result grid.
Drag the Parent Domain Name column (3rd column) to the top of grid to sort the report based on parent domain. You can also sort columns by clicking the column header. The following diagram illustrates the report:
Use Case 4
Description: Design a report based on diagram membership. Include entities and attributes and then export the report to HTML.
Follow these steps:
- Open a model for reporting.
- Click Tools, Report Designer.
- Click Create a report on the toolbar. The Report Editor dialog appears.
- Enter a name for the report.
- Select Logical/Physical as the report type.
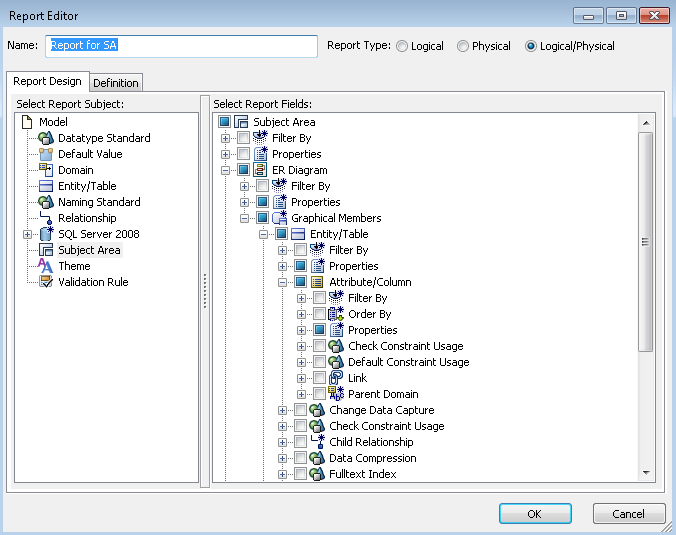
- Select Subject Area in the Select Report Subject pane.
- In the Select Report Fields pane, expand the ER Diagram node, expand Properties and the select Name.
- Similarly, expand Graphical Members, Entity/Table, Properties, and select Comment, Physical Name, as shown in the following diagram:
- Expand Graphical Members, Attribute/Column, Properties, and select Comment, Physical Name.
- Click Run Report.
The report is displayed in the result grid.
- Click Export, Export to HTML.
- Select the directory where you want to save the report.
- Browse through the report contents.
Copyright © 2014 CA.
All rights reserved.
|
|