

The Perf Stats tab lets you add the metrics and events that you want to monitor during the test run.
The Perf Stats tab consists of the following panels:
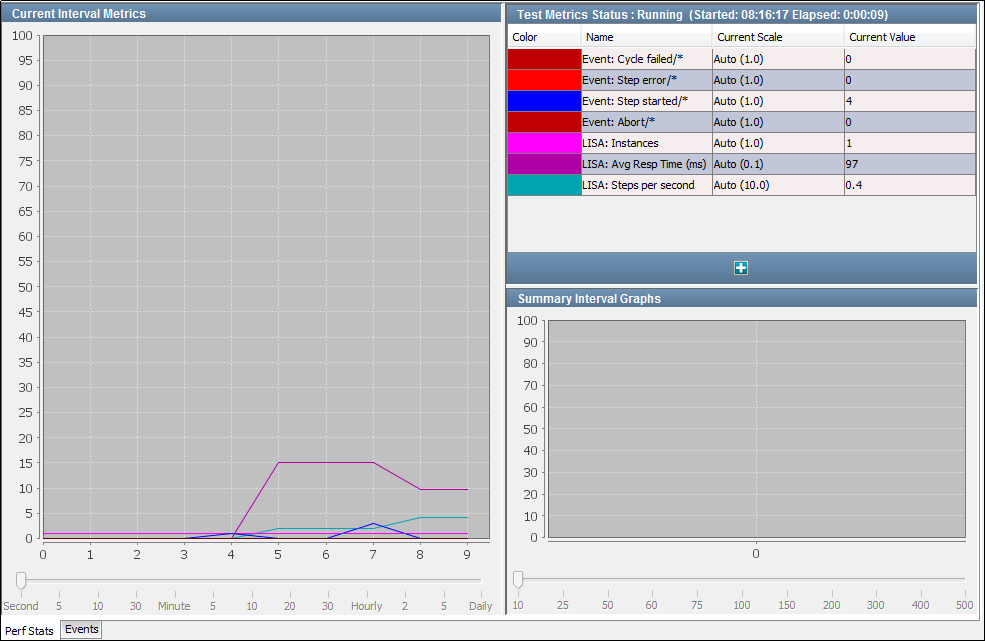
Test Metrics Status
The Test Metrics Status panel lists the current metrics being monitored.
Some metrics are shown by default. The metrics are color-coded to help you distinguish between them.
The Test Metrics Status panel contains the following columns:
The color coding that is used on the graphs.
The name of the metric. If the metric has been filtered using its short name, then the short name appears after a slash in the name field. An asterisk means use only the event name for the metric.
The vertical scale that is used on the graphs. You can adjust the graph scale on the Current Interval Metrics graph for any metric. Adjust the scale by double-clicking the Current Scale cell and selecting a new value from the drop-down list. You see the metric change scale on the Current Interval Metrics graph.
Note: The default setting for Current Scale is Auto Scale at 100. The number in () shows what Auto Scale has determined the scale value must be to fit all the data on the same 0-100 graph. The value * scale = y coordinate on the graph. If you modify the scale, the current value does not change. However, the calculation of determining the y coordinate used on the graph could yield a different y coordinate. If the coordinate is greater than 100, the Y-axis limits also must grow to accommodate the larger values.
The instantaneous value of the metric.
The metrics are based on sampling. For example, the instances metric is the number of virtual users running a test when the sample is taken. The number of instances that are waiting to run tests can be a higher number. For example, if pacing is configured in the staging document, the instances metric shows how many virtual users are running a test. This value can be less than the population of virtual users that are allocated in the staging document. Assume that you have 250 steady-state virtual users. If the instance count is 100, then the other 150 virtual users are waiting because pacing has them on hold.
For detailed information about metrics, see Generating Metrics in Using CA Application Test.
Current Interval Metrics
For each metric in the Test Metrics Status panel, the Current Interval Metrics panel displays the value at a specified time interval during the run.
To specify the time interval, use the slider at the bottom of the panel. You cannot adjust the value after the run has started.
Summary Interval Graphs
The Summary Interval Graphs panel displays the value of each metric in the Test Metrics Status panel, averaged over a specified time interval.
To specify the number of samples per interval, use the slider at the bottom of the panel. You cannot adjust the value after the run has started.
|
Copyright © 2014 CA Technologies.
All rights reserved.
|
|