

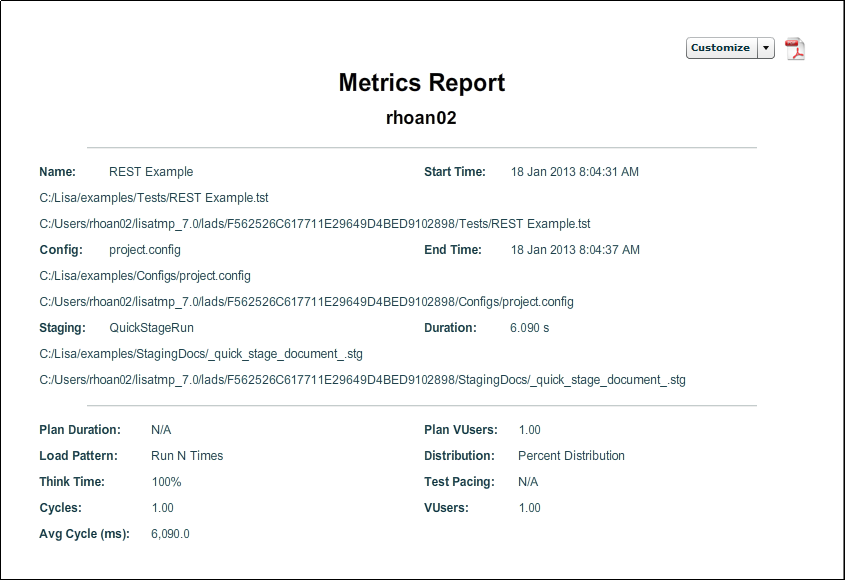
To produce a Metrics Report:
The Select a Report window opens.
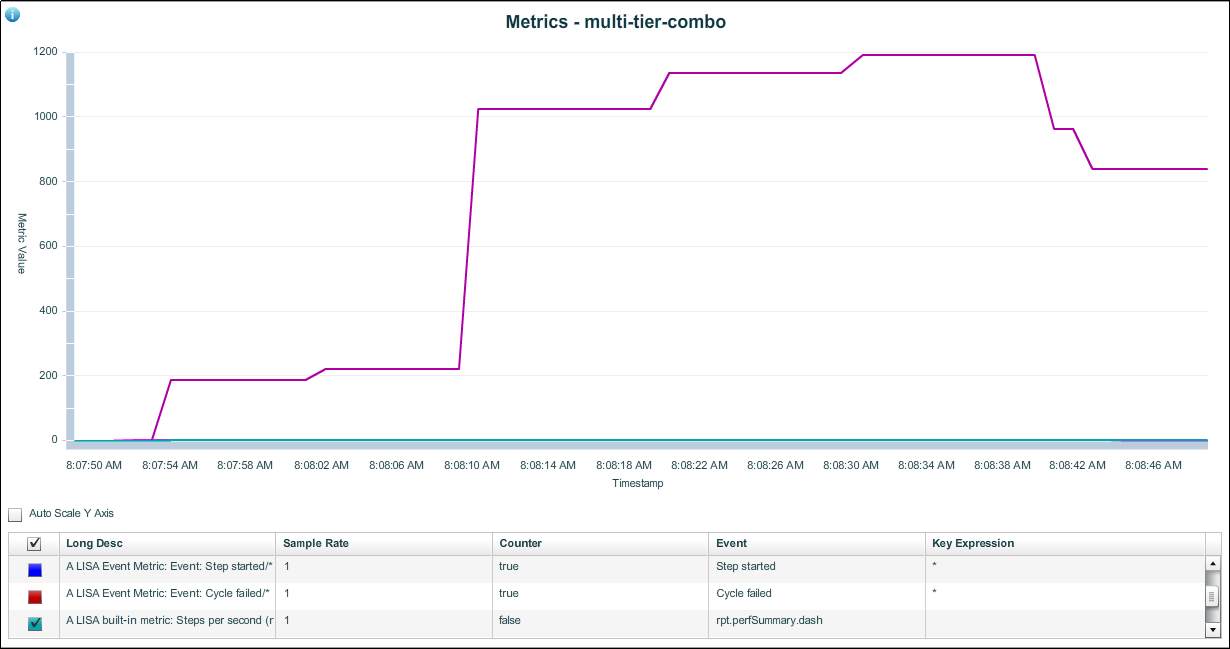
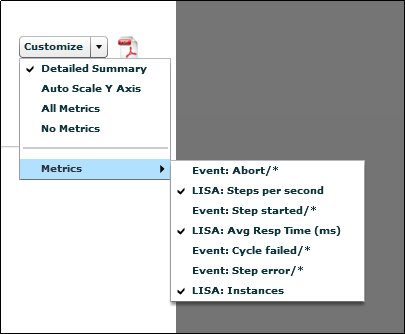
When you right-click to see the metrics chart on the window, the legend is interactive and you can select events and the auto-scale parameter. In the PDF report, use the Customize drop-down to make selections.
The Customize button allows you to select the following options:
Examples of each customized report follow.
Detailed Summary
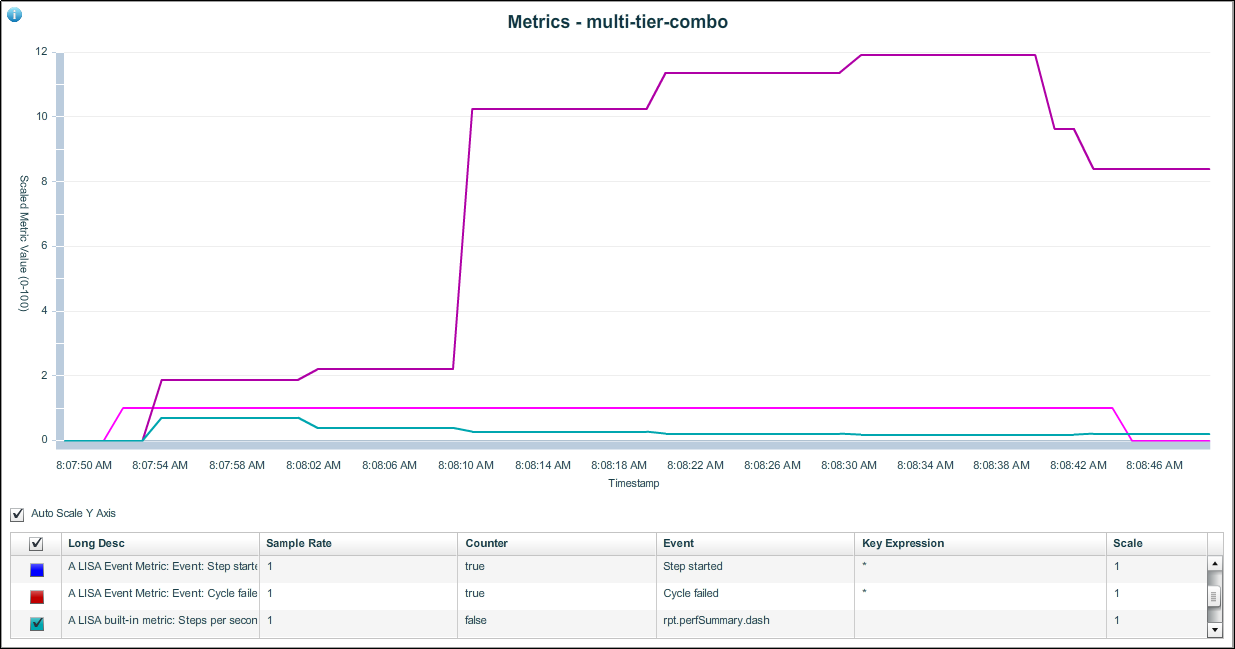
Auto-Scale Y Axis
Compare this report to the same report shown previously to see the auto-scaled Y axis.
All Metrics
All Metrics is the default selection for the metrics reports. If you have selected No Metrics or if you have selected Metrics in the Customize drop-down, you can select All Metrics to display all metrics available for the report.
No Metrics
When you select No Metrics from the Customize drop-down, all metrics are cleared from the Metrics Chart.
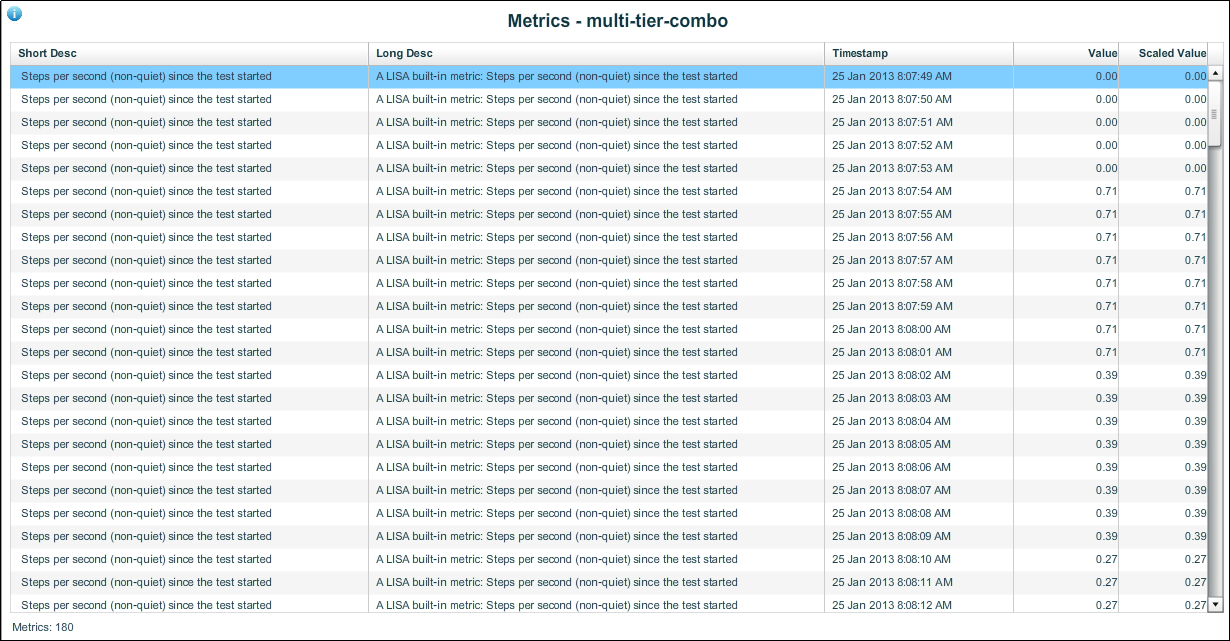
Metrics
You can select which metrics appear on the Metrics Chart by selecting individual metrics that are available in the Metrics drop-down.
|
Copyright © 2014 CA Technologies.
All rights reserved.
|
|