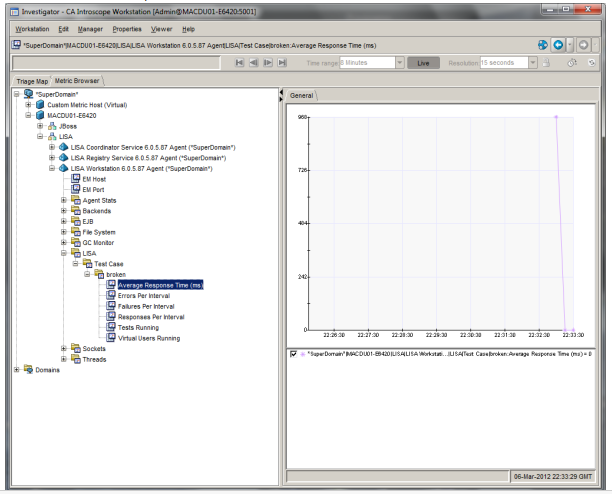

The following graphic shows typical sets of metrics that the Test Event tracer reports. In the following example, the simple test case named "broken" was executed. This test case contains only one test step that contains a configuration error. This error causes the test case to fail. The failure causes the "Errors Per Interval" and "Failures Per Interval" metrics to be reported as shown.

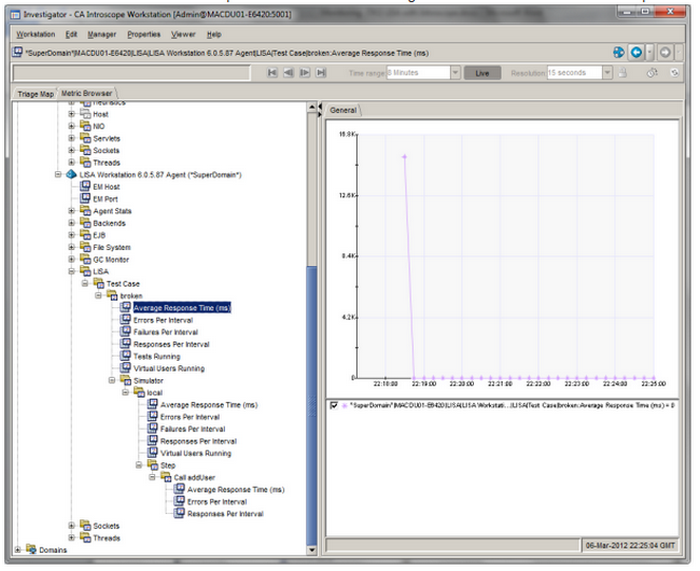
The following graphic shows the same test case that was run after the minMetricLevel parameter was changed from the default of TestCase to TestStep. Metrics are generated for simulator and test step levels.

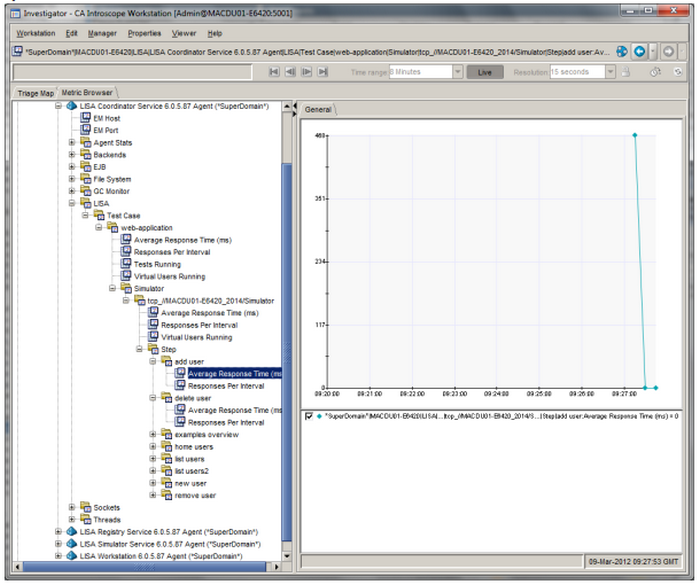
The graphic that follows shows a more complex test case that contains eight test steps and does not generate any errors when run. In addition, the test has been staged using separate coordinator and simulator processes rather than the processes built into the DevTest Workstation. This window shows the additional test step nodes, but no "Errors Per Interval" or "Failures Per Interval" metrics. The metrics are reported under a Coordinator Service Agent node (whose name has been customized to include the DevTest version number). Also notice that because the simulator name contained colon characters that are invalid in metric path names, the colons were replaced by underscores.

|
Copyright © 2014 CA Technologies.
All rights reserved.
|
|