

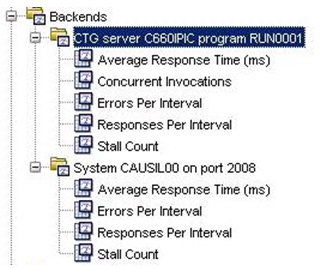
If you have installed the CTG CA SYSVIEW tracer, you will receive metrics concerning CTG calls made by the application that was instrumented with the tracer. These are blamepoint metrics for the calls to the method com.ibm.ctg.client.JavaGateway.flow().
These metrics are generated under the backend metrics and are called backends of the frontend metrics. They will also appear on the Triage map. You can mouse over the circular green metric icon that appears to the left of the triage map component (at which the arrow head points) to see these same metrics from the Triage map.
Backend metrics for the sockets (host/port pairs) used to communicate with the CTG server will also appear (which in this case is host CAUSIL00 and port 2008). This example has a single server/program folder and a single socket (host/port) folder but could have multiple of both.
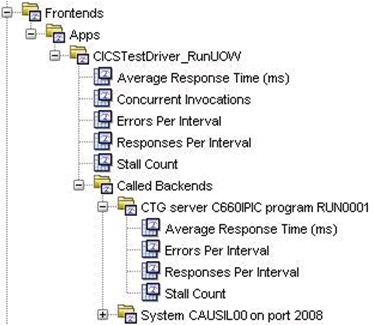
The CTG backend metrics will also appear under Called Backends for any frontends that call it. This is along with backend metrics for the host and port of the CTG server (which in this case is CAUSIL00:2008).
Participation in the Application Map will be as a backend with the same naming convention for the vertex being "CTG server server program program."
On the Workstation Triage Map you can view the backend generated by the CTG Tracer by selecting the frontend that calls it. A frontend must be generated to see this backend, so some pbd used must define frontend metrics for some method that in turn calls the method com.ibm.ctg.client.JavaGateway.flow().
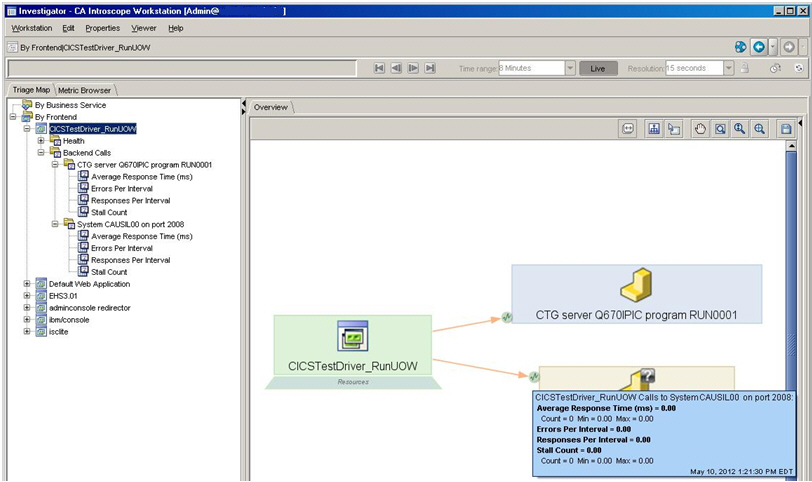
On the Triage Map above, the circular green metric icons at which the arrows point (located to the left of the CTG vertex labeled SYSTEM CAUSIL00 on port 2008) indicate that metrics exist. These metric icons can be used to access blame point metrics for the call to the method com.ibm.ctg.client.JavaGateway.flow(). These metric icons appear only when the application is up and the agent is connected to the EM. Just mouse over the metric icon and the metrics will appear as above.
|
Copyright © 2013 CA.
All rights reserved.
|
|