How to use the Console to Identify Problems › DB2 z/OS Buffer Pool Activity Dashboard
DB2 z/OS Buffer Pool Activity Dashboard
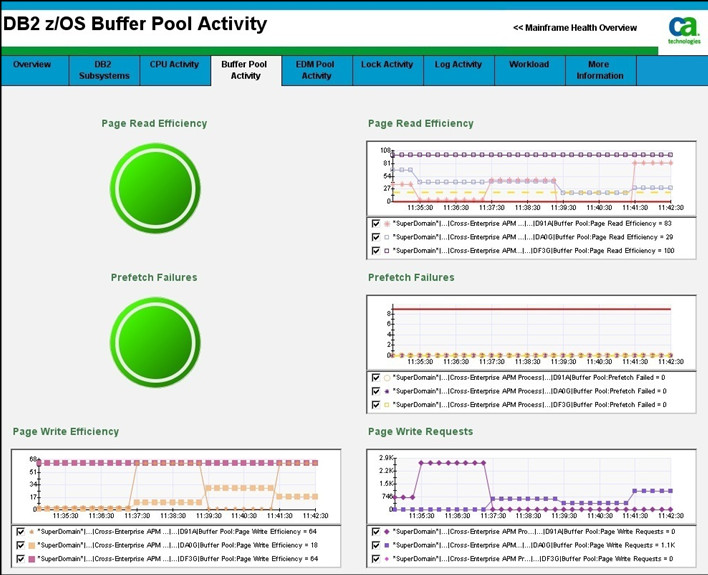
This dashboard displays the following information for each monitored DB2 for z/OS subsystem:
- Page Read Efficiency
- Prefetch Failures
- Page Write Efficiency
- Page Write Requests
- Synchronous I/O
- Asynchronous Writes
- Available Pages Percentage
- Buffer Pool Size
- Prefetch I/O
- Prefetch Reads
- Page Get Requests
- Prefetch Requests
- Group Buffer Pool Statistics
- Page Read Efficiency
- Page Data Reads
- Page Empty Reads
- Write Failures
For more information, see CA Cross-Enterprise APM Metrics.
Follow these steps:
Copyright © 2013 CA.
All rights reserved.
|
|