

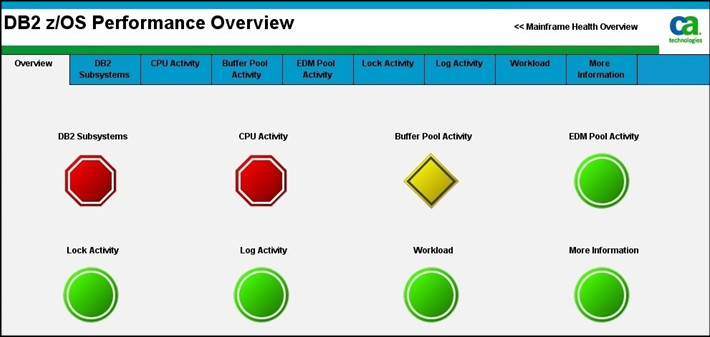
This dashboard offers a quick view of the health of all DB2 for z/OS subsystems monitored by CA Introscope. It shows alert indicators that report the status for the dashboards available from this Overview dashboard. Double-click the alert indicator to open the corresponding dashboards.
The following table identifies the dashboard alert indicators and corresponding dashboards monitored on this dashboard:
|
Dashboard alert indicator |
Dashboard |
|---|---|
|
DB2 Subsystems |
CA APM Cross-Enterprise: DB2 z/OS Subsystem Information |
|
CPU Activity |
CA APM Cross-Enterprise: DB2 z/OS CPU Activity |
|
Buffer Pool Activity |
CA APM Cross-Enterprise: DB2 z/OS Buffer Pool Activity |
|
EDM Pool Activity |
CA APM Cross-Enterprise: DB2 z/OS EDM Pool Activity |
|
Lock Activity |
CA APM Cross-Enterprise: DB2 z/OS Lock Activity |
|
Log Activity |
CA APM Cross-Enterprise: DB2 z/OS Log Activity |
|
Workload |
CA APM Cross-Enterprise: DB2 z/OS Workload |
|
More Information |
CA APM Cross-Enterprise: DB2 z/OS More Information |
Follow these steps:
To view the dashboards, from the CA Introscope console, select CA APM Cross-Enterprise: DB2 z/OS Performance Overview from the Dashboard drop-down menu.
The DB2 z/OS Performance Overview dashboard opens.
|
Copyright © 2013 CA.
All rights reserved.
|
|