How to use the Console to Identify Problems › IMS Subsystems Health Dashboard
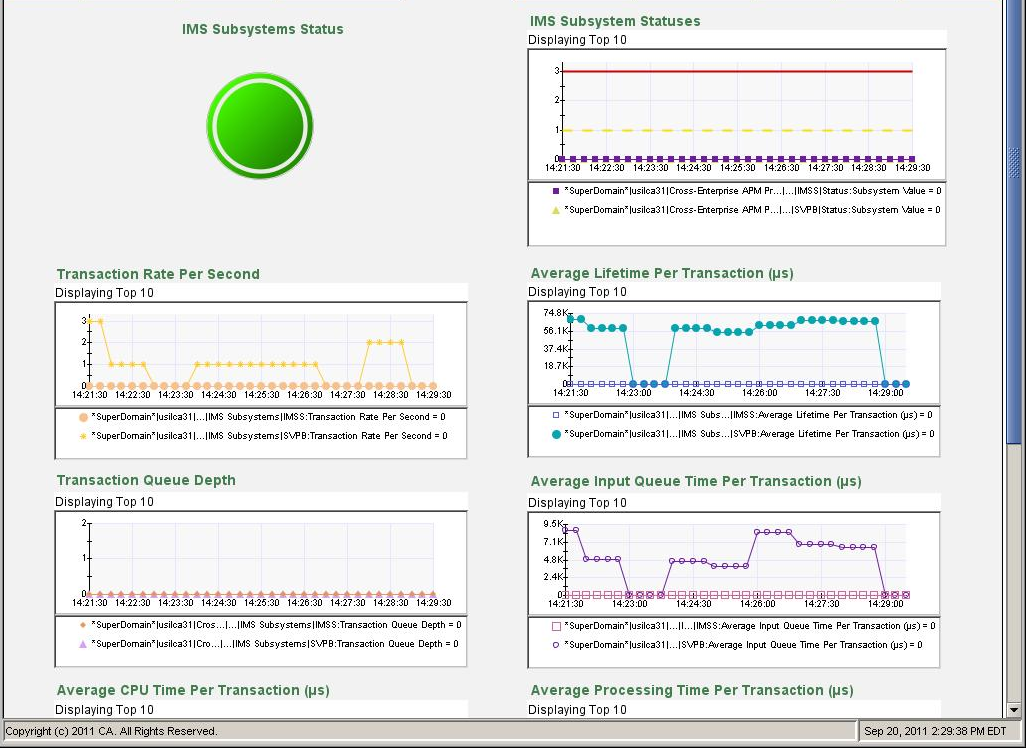
IMS Subsystems Health Dashboard
This dashboard displays the following key metrics to help identify problems with the health of IMS subsystems:
- IMS Subsystems Status alert indicator
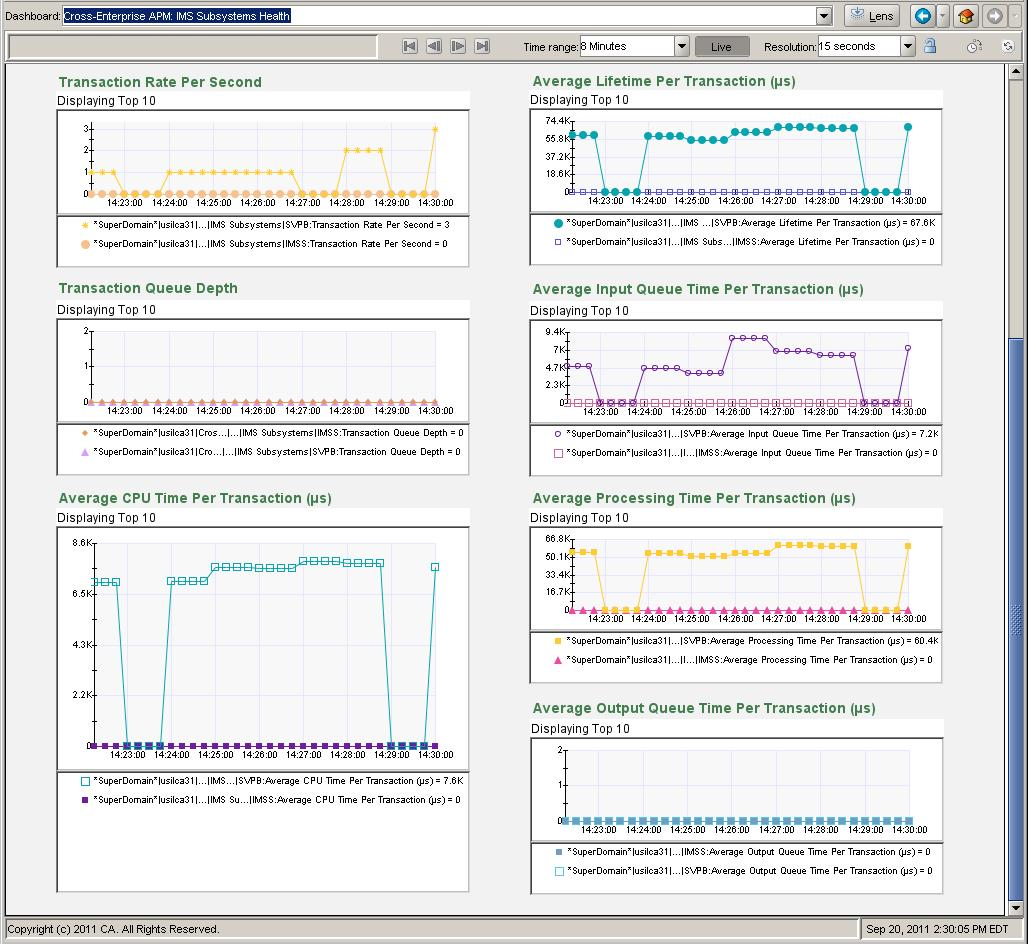
- Transactions Rate Per Second
- Average Lifetime Per Transaction(µs)
- Transaction Queue Depth
- Average Input Queue Time Per Transaction(µs)
- Average CPU Time Per Transaction(µs)
- Average Processing Time Per Transaction(µs)
- Average Output Queue Time Per Transaction(µs)
For more information, see CA Cross-Enterprise APM Metrics.
Follow these steps:
Copyright © 2013 CA.
All rights reserved.
|
|