

How to use the Console to Identify Problems › DB2 z/OS Performance Overview Dashboard › DB2 z/OS Data Sharing Groups Dashboard
DB2 z/OS Data Sharing Groups Dashboard
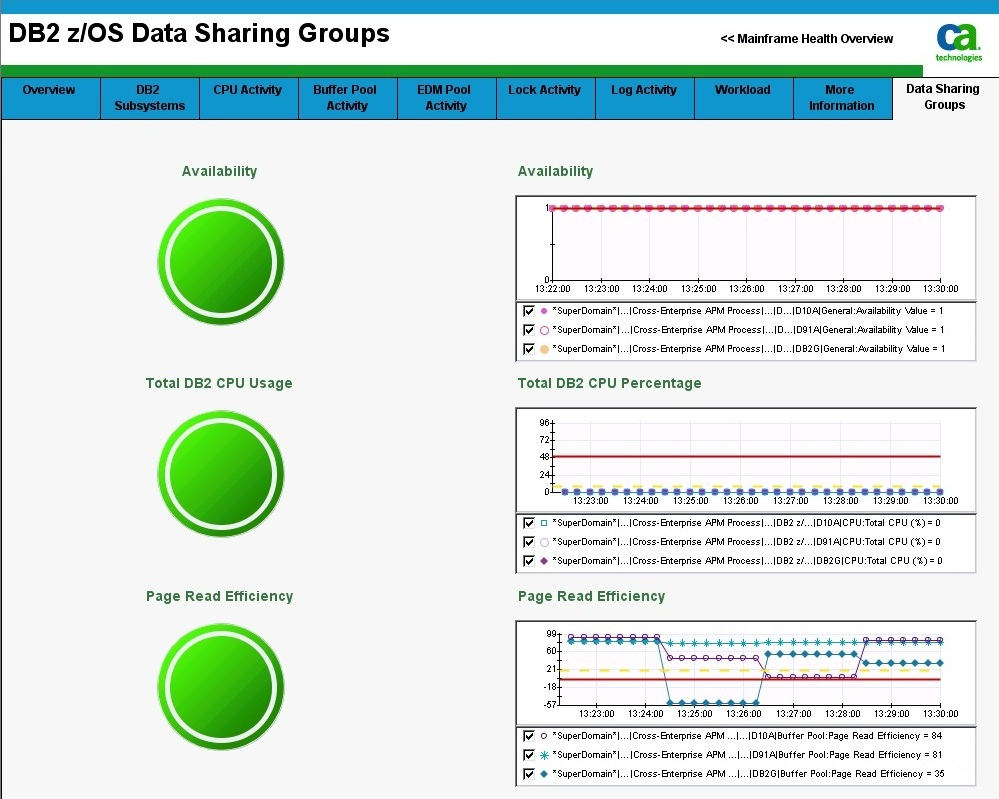
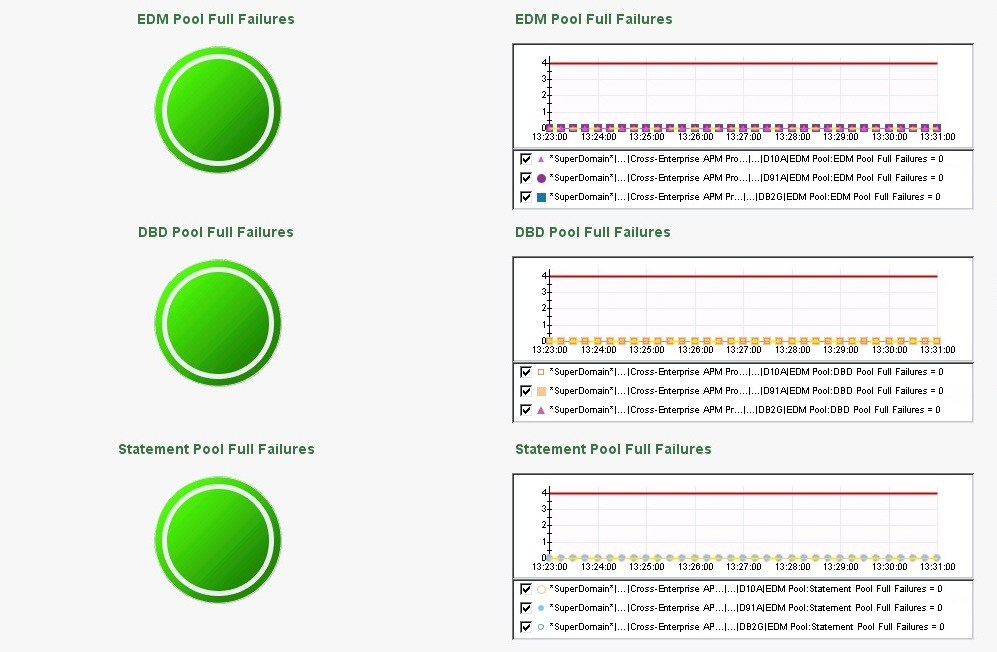
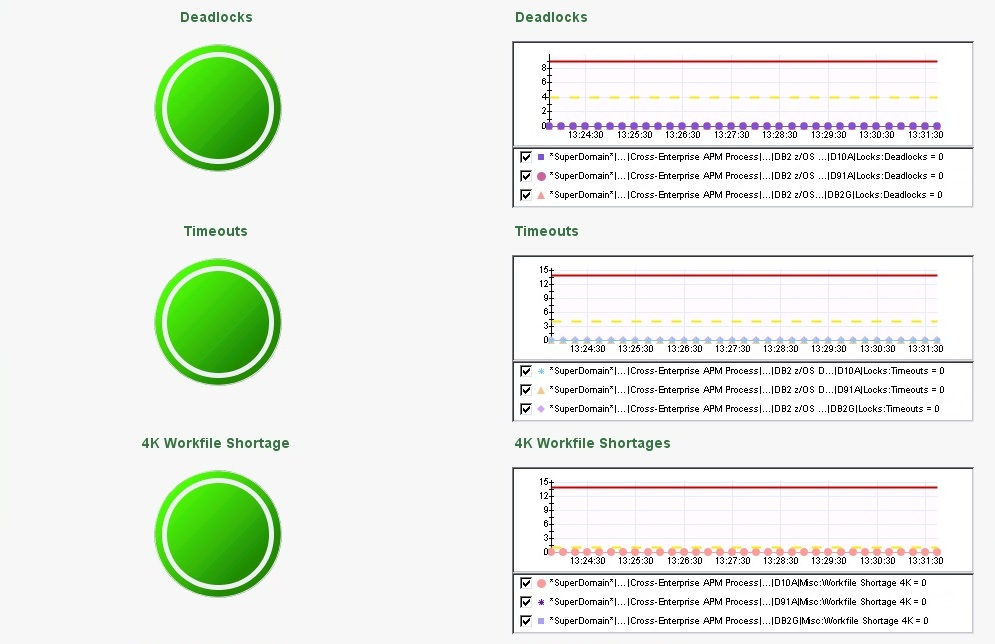
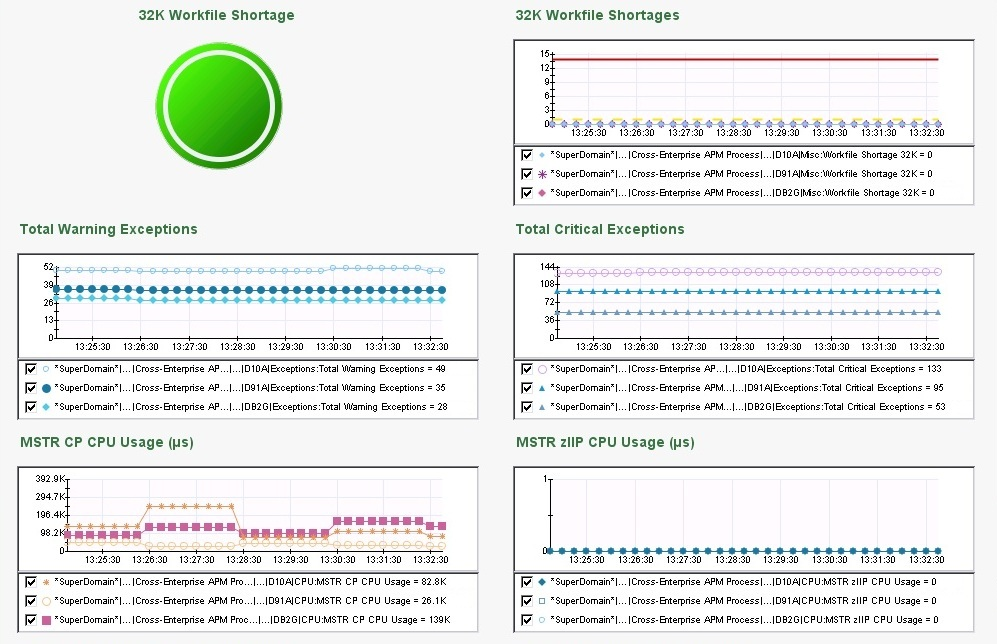
This dashboard displays the following information for each monitored DB2 for z/OS Data Sharing Group:
- Data Sharing Group availability
- Total DB2 CPU Usage
- Page Read Efficiency
- EDM Pool Full Failures
- DBD Pool Full Failures
- Statement Pool Full Failures
- Deadlocks
- Timeouts
- 4K Workfile Shortages
- 32K Workfile Shortages
- Total Warning Exceptions
- Total Critical Exceptions
- MSTR CPU Usage (CP and zIIP)
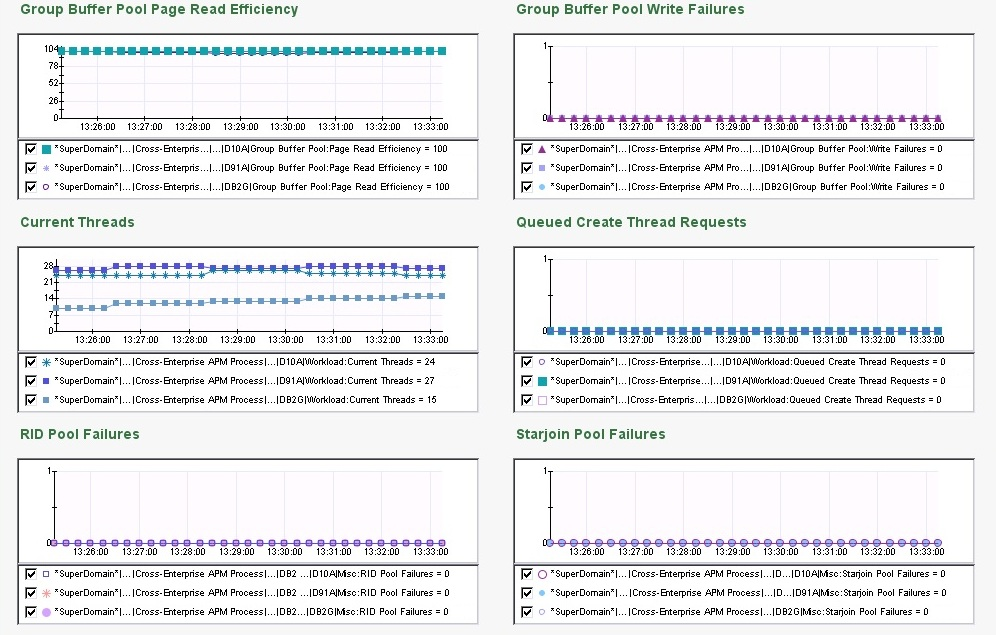
- Group Buffer Pool Page Read Efficiency
- Group Buffer Pool Write Failures
- Current Thread Count
- Queued Create Thread Requests
- RID Pool Failures
- Starjoin Pool Failures
For more information, see CA Cross-Enterprise APM Metrics.
To view the dashboard, from the CA Introscope console, select Cross-Enterprise APM: DB2 z/OS Data Sharing Groups from the Dashboard drop-down list.
The DB2 z/OS Data Sharing Groups dashboard opens:
Copyright © 2014 CA.
All rights reserved.
|
|