

This dashboard displays the following key metrics to help identify problems with the health of CICS regions:
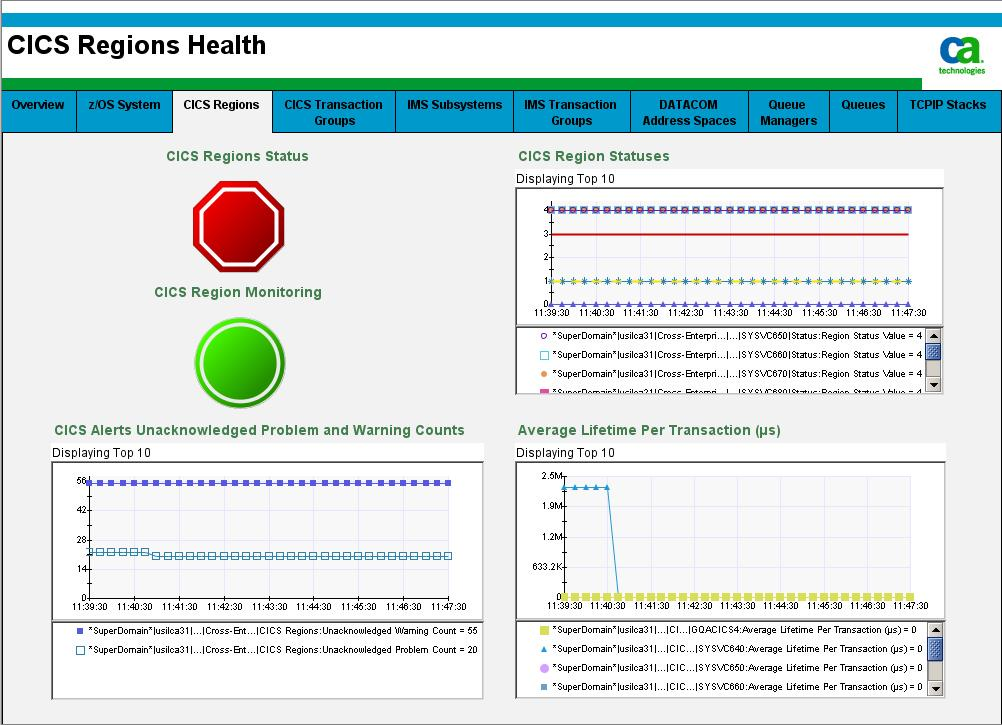
Displays the regions status value for all metrics.
Displays the region monitoring value metrics for all regions.
Displays the regions status value for the top ten CICS regions.
Note: The graph only shows the unacknowledged problem and warning counts, not the total unacknowledged count.
For more information, see CA Cross-Enterprise APM Metrics.
Follow these steps:
The CICS Regions Health dashboard opens.
|
Copyright © 2014 CA.
All rights reserved.
|
|