

All metrics are reported on every polling interval unless the alert has been acknowledged, in which case, the metrics are absent and they go gray.
Only the alerts that are unacknowledged appear in the Workstation Investigator tree. Metrics appear under the z/OS Metrics|Alerts folder, which give total counts of these unacknowledged alerts. If you want alerting on the CA SYSVIEW z/OS alert activity, use these metrics to generate the APM alerts through the management module editor.
The current number of alerts that have a status of problem.
The current number of unacknowledged alerts.
The current number of MQ alerts that have a status of warning.
The metrics for each z/OS alert appear under the folder: z/OS Metrics|Alerts|<Alert Name>_<Resource Name>_<Alias Name>.
The name of the alert. In CA SYSVIEW, it is the variable name for the data collection element of the alert. This metric is the prefix of the folder name for the alert.
The current alert threshold status. This value can be NONE, NORMAL, HIGH, WARNING, or PROBLEM.
The current alert threshold status as a numeric value. This value can be 0=NONE, 1=NORMAL, 2=HIGH, 3=WARNING, or 4=PROBLEM.
The alias of the alert. In CA SYSVIEW, it is the alias for the resource argument. This metric is absent if it has no value. This value becomes the third underscore separated segment of the metric folder name for the alert when it exists.
A description of the alert.
A group classification for the alert.
The priority of the alert from 0 through 999 with 999 having the highest priority.
The resource of the alert. In CA SYSVIEW, it is the resource argument that is used to qualify the collection element of the alert. This metric is absent if it has no value. This value becomes the second underscore separated segment of the alert folder name when it exists.
The exception rule type. Possible values are:
The value last used during threshold processing. If the resource does not currently have an associated threshold definition, the value is the last value the data Collector collects.
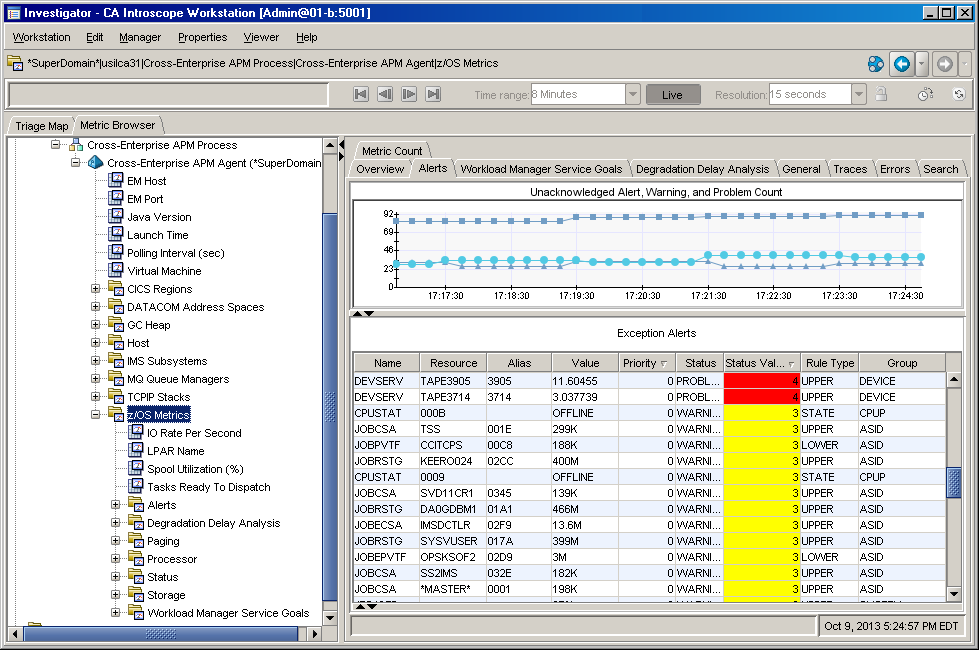
The typeview on the z/OS Metrics folder tab Alerts has the following display:
Similarly, the typeview also displays on the Alerts folder tab Overview. The columns are sorted on Priority and then Status. In this way, the highest priority items appear at the top of the list with the highest status of those items first. The status value column is color-coded to severity with Red = Problem and Yellow = Warning. Selecting the z/OS Metrics | Alerts folder tab Overview brings up the identical typeview.
|
Copyright © 2014 CA.
All rights reserved.
|
|