

Graphs include various graphical elements that depict your servers, services, applications, relationships, and so on. The Visualization page contains a legend in the right pane that describes the elements in the current graph. Additionally, you can expand nodes on certain elements or mouse-over them to display additional details.
The following procedure describes how to view the details about an application element and the server in which it is installed. It also includes an example of the workflow used to filter the view to only the servers with a specific application installed, and to optionally save that view.
To expand an element to display details
The Visualization tab page appears.
The main visualization pane displays all servers known to CA Configuration Automation that have applications installed (likely all of them).
The Graph Filter dialog appears.
Linux appears in the Operating System column.
There may be multiple versions of the application (3.6.13, 3.6.14, and so) installed on servers, so select all that you want included. The select versions of the application appear in the Selected Applications column.
The graph is filtered to only display servers with the selected application installed:
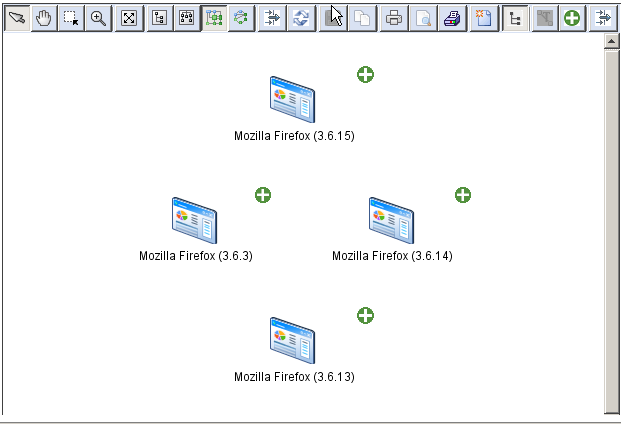
 that you can double-click to display the child element of this application (in this example, the server that hosts it). Right-click the server icon and select Go To Parent to return to the previous view.
 above the graph to expand all nodes, or double-click an individual node icon in the graph to expand an individual node.
Server icons representing the servers where the application is installed appear.
You can mouse-over a server icon to display server details (including the assigned Management Profile, status IP address, operating system, and so on) or right-click to display relationship details, or perform server management operations (for example, Create Snapshot, Run Change Detection, and so on).
|
Copyright © 2014 CA.
All rights reserved.
|
|