

To facilitate comprehensive and integrated network polling and administration, CA NSM uses Agent Technology to automate manager tasks and responses to events. Agent Technology monitors and reports the status of your resources and applications and lets you manage those resources (also called managed objects). The status of a resource is displayed within the Management Command Center and on the WorldView 2D Map.
This chapter explains the basic functions of four aspects of monitoring your enterprise:
A monitoring option that can be deployed instead of Agent Technology. Its manager (called the agent) runs on the Windows platform, and it can quickly discover and begin to monitor your resources. No installation is required on the remotely monitored machines.
The agent side of Agent Technology, which gets installed on remotely monitored devices. Specific agents monitor specific system resources, such as CICS resources, Active Directory Services resources, log files, UNIX/Linux system resources, Windows Management Instrumentation Resources, Windows System resources, and z/OS resources.
The manager side of Agent Technology, which gets installed only on the management server, known as the Distributed State Machine (DSM). It controls the discovery of remote agents and monitored resources and maintains the status of these resources based on information received from the agents.
Unicenter Configuration Manager provides an interface for the reporting and management of configuration information for remote and distributed Agent Technologyand Event Management components.
To determine when and how to use Remote Monitoring effectively, you need to understand both the advantages and disadvantages of deploying this non-intrusive monitoring technology.
Because the agent does not have to be installed on each monitored resource, you can quickly get it up and running. For example, instead of installing an Agent Technology agent on 200 or more managed nodes, you install a Remote Monitoring Agent on only two machines that monitor those 200 machines.
The faster deployment means you can quickly see results of your investment.
Because a single agent machine can monitor hundreds of network resources, maintaining and supporting your monitoring environment requires less time and uses fewer human or hardware resources.
The agent, which also acts as the manager, runs on a separate machine and, therefore, will not disturb your production environment.
Because remote agents must pull all data back to the agent machine for processing, it causes more network traffic than traditional Agent Technology.
The remote agent is unable to gather some of the data gathered by a traditional agent, because it does not reside on the monitored resource. Depending on the type of information that you need to monitor and, because, Remote Monitoring Agent may not be able to discover and monitor a specific resource that is important to your environment, you might decide to deploy the traditional Agent Technology.
Note: For more information about Remote Monitoring, see CA NSM - Remote Monitoring online help.
This topic explains the Remote Monitoring architecture, which will help you determine if Remote Monitoring Agent is best suited to monitor your environment.
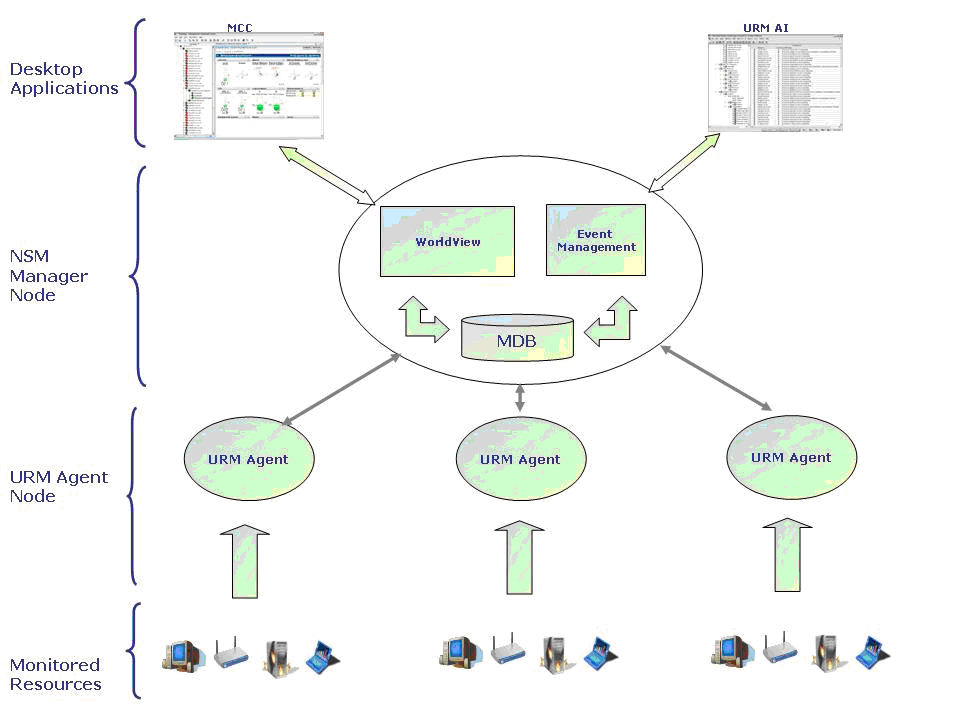
Remote Monitoring consists of the following three major components:
The Administrative Interface is the client application used to discover resources, configure resources, view status updates, and manage the metrics used to monitor each resource. This component runs on Windows computers only.
Note1: Although the Administrative Interface provides the graphical user interface (GUI) used to discover resources, the agent actually does the work to probe the network and discover resources. Therefore, the Administrative Interface is not required to have administrator privileges to access the monitored resources.
Note 2: You must have the appropriate privileges to discover resources. Before you start the discovery process, ensure that the agent computer has the appropriate administrator privileges to gain access to your network resources or that an administrative account is associated with each node to be monitored.
The Remote Monitoring Agent is responsible for polling all monitored resources and determining if an error has occurred. The agent can broadcast monitored resource status to a Unicenter Event Management Console, WorldView repository, and to any number of Remote Monitoring Administrative Interfaces.
The Agent runs on Windows computers only. Although it can reside on the same computer as the Administrative Interface, you can also install it on a separate Windows computer and access it from a remote Administrative Interface.
The data store contains all configuration information used to determine the current status of a resource. Data gathered from the most current poll is compared to the values stored in the data store, and any changes to a resource's state are communicated back to the agent. The data store is installed on the same computer as the Agent.
The following diagram illustrates how these components work together:
Remote Monitoring lets you monitor multiple platforms and resource types throughout your network. The following table lists all operating systems, the versions currently supported, and the type of information you can monitor for each:
|
Operating System |
Versions |
Information Types Monitored |
|---|---|---|
|
Windows |
|
Event logs Services System Metrics Detailed Metrics Registry Keys |
|
AIX |
|
System Metrics Detailed Metrics |
|
FreeBSD |
|
System Metrics Detailed Metrics |
|
HP-UX |
|
System Metrics Detailed Metrics |
|
Linux |
|
System Metrics Detailed Metrics |
|
Mac OS X |
|
System Metrics Detailed Metrics |
|
Solaris |
|
System Metrics Detailed Metrics |
|
Tru64 |
|
System Metrics Detailed Metrics |
In addition to monitoring these platforms, Remote Monitoring provides IP resource monitoring. This type of monitoring lets you gather the following information:
Indicates whether the system is responding.
Determines whether the response time is reasonable.
Issues an alarm based on a state change, such as a port that is responding when it should be turned. off (not responding).
By default, all users are given full access to the Remote Monitoring features upon opening the application, and no login is required. However, you may have users who do not need to make configuration changes, but only need to monitor the status of your resources using the Remote Monitoring Administrative Interface. In this case, you can implement a role-based security scheme so that only administrators can access and change your monitoring configurations.
This role-based security access is an optional feature that provides the following two levels of security:
Provides full access to the application.
Limits access to viewing the resource status information.
To implement this type of security, define one or more administrator accounts. Defining an administrator account puts the role-based security scheme into effect, and this security stays in effect as long as at least one administrator account is defined.
When this security is in effect, the default role is User. This means that upon opening the application, all configuration editing features are disabled. To gain administrative rights to the application, administrators must explicitly log in to the application, using the account you have defined. Upon successful login, the administrator is given full access to the application.
To determine when and how to use Resource Monitoring effectively, you need to understand what this monitoring technology can do for you.
After startup, the system agents immediately start monitoring the system resources based on a predefined configuration. Lists of available (auto-discovered) system resources let you easily customize your agents during runtime to meet the specific requirements of your system.
An agent monitors system resources on the base of watchers. A watcher is the term used for any instance of a monitored resource that has been added into the agent's configuration. The agent evaluates the status of a specific resource according to the assigned watcher configuration.
To prevent losing a change in its configuration, for example, as a result of a power failure, the agent writes back its configuration data periodically. The duration of this period can be specified with the start command of the agent.
Some of the system agents support Auto Discovery. For some specific resource groups the corresponding agent adds watchers into its configuration automatically by applying filter conditions to the available lists. The agent uses the default values from the MIB to specify the properties of these watchers.
Most of the system agents support the general functions listed in the following sections. The descriptions in this section provide a brief overview. For further details, procedures, and examples, see the corresponding references.
At startup the agent automatically discovers the system for monitored resources, but it depends on the type of the resource, whether the agent automatically creates a watcher for it or not. If a resource type appears in the form of only a few instances that shall always be monitored, it may be suitable for customers that corresponding watchers are automatically created (for example: CPU, Network Interfaces).
However, if a resource type appears in the form of many instances, for example file systems on UNIX servers; you may want to specify a particular subset of these instances that shall be monitored by the agent. For this case the agent does not create watchers automatically, but creates a list of the available objects (instances) of a resource type that can potentially be monitored.
Based on filter conditions of the available list you can specify a set of instances that you want to monitor and define an auto watcher for this set. Then, the auto watcher automatically creates individual watchers for those instances that match the filter condition. For example, you can specify a filter condition for the mount devices of the file systems and create an auto watcher for swap file systems only. Such an auto watcher creates individual watchers for each available swap file system on that server.
For monitoring files and processes the agent provides one-to-many watchers instead of auto watchers to monitor a specific set of instances by a single watcher. If the status of this set changes to warning or critical, the agent creates a culprit list that contains all monitored instances that caused the status change.
For example, you can specify a filter condition for the process path to monitor all processes that belong to c:\Windows\system32 by a single watcher. In the case of a Down status the agent creates a list of items (process-ID:utilization value), which identifies the processes that caused this status. The sort order and length of this list depends on the severity of the violation, for example: 408:222|409:333|475:444
The call-back mechanism of system agents enables you to assign an automated task or action to a particular event within the agent layer of the CA NSM architecture. This assignment is accomplished by means of a call-back reference which can be set up for each functional area of the agent, such as one call-back reference for CPU, one call-back reference for logical volumes, one call-back reference for files, and so on.
These call-back references can only be defined in an agent's call-back configuration file (for example: caiUxsA2.cbc) that can be secured by access rights. This configuration file is stored in the Install_Path/SharedComponents/ccs/atech/agents/config/cbc directory. It contains an entry for each call-back reference, and associates with this reference the full path and name of the script or application to run. Additionally, parameter information can be passed to the script or application, as well as a user ID that should be used to execute the script or application.
The advantage of using this additional level of indirection or call-back reference is that the name of this reference can be safely shown in the MIB without causing any security exposure, because the actual path and name of the call-back script or application is hidden within a secured file. This reference also enables you to remotely check in a secure way if a call-back reference has been configured for the respective monitored area.
Note: In the MIB the call-back reference name is defined as read-only. Therefore it cannot be set or modified by Agent View or the MIB Browser. The reference name can only be configured through a definition in a configuration set.
To provide improved functionality, you can specify that the agent will pass a set of predefined or user-defined parameters to the call-back script or application upon instigation. These predefined parameters will contain the following information:
By passing these parameters to the call-back script or application, it will enable you to build powerful scripts. These scripts can perform different actions depending on the state of the monitored resource.
Basically, support of monitoring clusters with CA NSM system agents is based on the CA High Availability Service (HAS). HAS is a set of extensions to Unicenter which enables Unicenter components to operate within a cluster environment, to function as highly available components, and to failover between cluster nodes gracefully. The system agents (caiUxsA2, caiWinA3, caiLogA2) use CA HAS and are cluster aware. This means even though those agents are running multiple times within the cluster (on each physical cluster node) only one agent monitors a shared cluster resource such as a shared disk.
No specific configuration is required for using these agents in a cluster, except for monitoring processes. The appropriate name of the cluster resource group (cluster service) must be specified when creating a process watcher.
Note: For more information, see the section Cluster Awareness and the appendix "High Availability Service" in the Inside Systems Monitoring guide, and the appendix "Making Components Cluster Aware and Highly Available" in the Implementation Guide.
Configurable resource auto discovery eases implementation phases, reduces the need for manual configuration, and discovers new resources dynamically, as they become available. An additional configuration group filter attribute serves as the criteria for an automatic resource detection and watcher creation mechanism.
All the watchers of the system agents are editable. No watchers have to be removed and then re-added. If attributes of a watcher (for example, thresholds) are modified, the status of the watcher will be re-evaluated based on the current poll values. Therefore, modifying a watcher does not invoke polling.
For analog metrics of one-to-many watchers there are several possibilities to calculate the metric value. An evaluation policy makes this evaluation watcher-specific. If the result violates the monitoring conditions, a culprit list is determined. The form of the culprit list depends on the evaluation policy setting and different kinds of thresholds (rising/declining) or minimum/maximum ranges.
The supported evaluation policies are: sum, max, min, average, and individual.
The UNIX System Agent and the Windows System Agent provide the generic resource monitoring concept that lets you extend the monitoring capabilities of Hardware monitoring and Programmable Resources monitoring by using external scripts or programs. These scripts must be “registered” in the Generic.ini file and have to provide a special output format for the evaluated data.
The History Table lists the last n enterprise-specific status traps the agent raised. The value of n is a configurable attribute in the history group (<xyz>HistoryMaxEntries). Setting this value to 0 causes the agent not to store any trap history.
The trap history collection can be switched on and off on a per resource group basis. This feature is especially useful, if toggling watchers cause the trap history table to be filled again and again.
The system agents allow warning and critical thresholds to be set independently for all relevant functional areas.
For the most resource groups the system agents offer a status, which reports the loss or the existence of the resource from the watcher's point of view. The watcher reports a resource as lost or nonexistent, if it is unable to access the resource.
Beside the physical loss of monitored system resources, a logical loss has to be considered. For example: print queues can be unavailable for various reasons. The UNIX System Agent implements configurable logical and physical loss status monitoring. The propagation and evaluation of detected resource outages can be fine-tuned on a per instance basis.
For many system agents the CA NSM r11.2 DVD ships files that contain definitions of all possible Event Message records as well as Action records. This considerably simplifies the creation of customer specific evaluations for the NSM event console.
Furthermore the CA NSM AEC component provides predefined correlation rules for the CA NSM r11.2 system agents.
Minimum/Maximum metrics are binary metrics. They are used to monitor resources which have quantity characteristics that should stay within a specific interval. The agent provides two forms of minimum and a maximum metrics:
This type provides a minimum and a maximum threshold (monitoring condition) and a monitoring level to determine the status of the resource. Detected resource values, which are greater than the minimum threshold and less than the maximum threshold, or which are equal to the minimum or maximum threshold, define the Up status for this metric. All other values define the down status.
This type provides a minimum and a maximum range which are monitored through critical and warning thresholds leading to effectively four threshold borders:
CritMin <= WarnMin <= WarnMax <= CritMax
The logic of the metric can be changed by using additional policies, for example, the evaluation policy.
Files and directories can be monitored for being modified or unmodified. In both cases the dates of the corresponding files are used, that is, the file or files addressed by a file watcher or the entries in a directory including the directory itself (.) and all subentries if the recursive option is set.
The system agents enable the Agent View (Abrowser) to propagate the most severe state of resources reported on the resource type specific windows to the Status Summary window. The Status Summary window summarizes the status of all monitored resources. It also displays the total number of monitored resources for each object type and the overall status according to the agent.
In most cases, you define thresholds as percentages, but sometimes it is useful to define absolute values instead. Percentages are suitable where a high degree of resolution is not required. Additionally, they can provide generic values across many machines. Absolute values enable a far higher resolution. The overloaded thresholds concept lets you configure thresholds with the following scales:
The agent will always convert the overloaded value entered by the client into an absolute used value and store this value in the MIB. This value is used for validation and status checks. The overloading must be the same for warning and critical thresholds. Not all kind of overloading is possible by all thresholds. For details see the MIB description.
Through MIB Browser, the manner in which the client distinguishes the type of overload is by appending the percent (%) sign or F symbol to the value. In Agent View, this translation is performed dynamically, using slider widgets and graphical controls.
The system agents perform periodic configuration stores. To minimize overhead, an appropriate concept ensures that only configuration information that has changed since the last store operation is written back. If the system is being closed down, only recent configuration changes need to be stored, rather than the entire configuration.
For each resource group the agent provides a method, which lets you disable the polling of any metric for that group completely. You can allow polling only triggered by the poll interval or allow polling also by a query. This property can be used to save performance in the agent.
The system agents allow individual object instances to be monitored for all relevant functional areas.
The system agents simplify the definition of new watchers by implementing a selection or available list from which the administrator can choose the specific resource they wish to monitor. The list will be generated, on demand, as per user-defined filter criteria.
For resources whose growth can consume finite resources on the machine (such as data files, and so forth), the concept of delta monitoring has been employed where feasible. This allows the agent to record the difference between the size of the resource during the last polling interval, and the size of the resource returned by the current poll. If this difference exceeds a client-defined threshold, an alert is issued. As a monitored object such as a file can contract as well as expand, it is also possible to calculate a negative value for a delta. The delta reported by the agent is always a positive or negative integer that simply reflects either the factor of growth or contraction of the resource. In the case of overloading the delta value may appear as a decimal value, for example: 99.86%.
To allow you greater flexibility when configuring the delta watchers, a type of overloading is implemented. This allows you to specify a threshold for growth, shrinkage or change in both directions. In addition to this it is possible to use the percentage type of overloading as well. You can define thresholds in the following formats:
n- absolute shrinkage
n+ absolute growth
n absolute change in both directions
n%- percentage shrinkage
n%+ percentage growth
n% percentage change in both directions
The threshold will always be entered as a positive value even if it is used to threshold against shrinkage. The actual delta value stored in the MIB is a positive or negative value to indicate the change as growth or shrinkage.
To provide meaningful monitoring for resources that can peak for a very short period without a problem occurring, the agent can be configured to check for several threshold breaches before the state changes. This is configured by lag attributes. The lag specifies the number of consecutive threshold (b)reaches on which state changes. If the lag is set to one then the status behaves as if there is no lag. If the lag is set to two then the threshold needs to be (b)reached twice in a row to change the state.
The agent offers an aggregate lag attribute for all resources having an aggregate status. This lag defines the number of consecutive poll intervals on which any status of the monitored resource is not in the OK or Up state, before the aggregate status changes.
SNMPv3 support is encapsulated in aws_sadmin. CA NSM r11, r11.1, and r11.2 system agents support SNMPv1 or SNMPv3, depending on an aws_sadmin configuration option.
The warning and critical values in the traps are absolute values even if you have percentage thresholds defined. Without a total value you are unable to judge the scale. For this reason the total value is added to the status and info traps.
An agent monitors IT resources on the base of watchers. A watcher is the term used for any instance of a monitored resource that has been added into the agent's configuration. The agent evaluates the status of a specific resource according to the assigned watcher configuration.
Usually a watcher consists of a set of metrics which are used to compare the detected values of monitored resources with monitoring conditions by considering settable monitoring levels. The result of this comparison is the status of the monitored resource according to the metric settings. The status of the watcher is the worst case aggregate of all associated resource statuses. If the aggregate status of a watcher changes, an info-trap can be sent to the manager. The info-trap contains information about the monitored resource that caused the status change.
Two basic watcher types can be distinguished:
A watcher is mapped to a single resource that shall be monitored. Characteristics of the monitored resource are evaluated by appropriate metrics. For example, a file system is monitored by a single watcher and different metrics are used to detect the status of file system characteristics such as size.
A watcher is mapped to a set of resources (instances) that shall be monitored. Common characteristics of these instances are evaluated by appropriate metrics. Unlike the one-to-one watcher a culprit list is provided to identify those instances that cause a status change of the watcher. Additionally, an evaluation policy defines for one-to-many watchers, how metric values, statuses total values and culprit lists of monitored instances are calculated. For example, processes or files can be monitored by one-to-many watchers.
This section describes the resources that can be monitored by system agents.
Active Directory Management provides an enterprise-wide view of your Active Directory environment and supports the Active Directory Knowledge Base.
The Active Directory Explorer (ADE) is part of Active Directory Management. It is the main user interface for monitoring the Active Directory environment. ADE provides an instant view of the aggregated states of your forests, domains, sites, domain controllers, site links, and subnets. It lets you drill down into any of these components, providing a highly detailed enterprise and component-level view of your Active Directory environment's behavior.
Active Directory Management consists of the following components:
The Active Directory Enterprise Manager creates and maintains all Active Directory objects according to the following enterprise-wide Active Directory resources it monitors:
The Active Directory Enterprise Manager queries the Active Directory for information about these resources. Additionally, it polls the Active Directory Agents on all monitored domain controllers in all forests for domain controller-specific metrics and statuses.
The Active Directory Enterprise Manager analyzes the information it gathers from enterprise-wide Active Directory resources and displays it through Active Directory Explorer. Based on this information it provides an enterprise-wide view of your Active Directory resources.
The Active Directory Services Agent can run on any Windows 2000 server platform or higher if the system is a member of an Active Directory domain. However, the complete monitoring capabilities offered by the agent are only available on a system that is defined as an Active Directory domain controller and as a DNS server. On other systems within an Active Directory Services domain, information on disk space resources, on extended resources, and on one or more performance resources is not available.
The Active Directory Agent monitors the following critical areas:
Note: When you install the agent on a member server, only the subset of the previously listed resources pertinent to all servers is available for monitoring.
The CICS Agent provides status, event, and configuration information about a CICS region and the transactions that are executed within it. The agent enables you to monitor the key resources, such as DSA and memory, of your CICS regions. The agent can monitor individual resources as well as the "health" of an entire region, allowing you to quickly determine the cause of a problem.
The CICS Agent puts you in control by allowing you to determine the warning and critical thresholds for each monitored resource. The agent monitors these resources and, whenever a user-defined threshold is exceeded, sends an SNMP trap.
The CICS Agent runs in IPv6 environments.
|
Copyright © 2010 CA.
All rights reserved.
|
|