

You can show operating and capital costs separately on the financial summary page and in a detailed financial plan. You can enter the cost information in the following ways:
Financial Summary Page
The financial summary page for an investment displays high-level operating and capitalization costs for planned and budgeted costs. You can edit the amounts on the financial summary until you create a cost plan of record (POR). When you create a POR, the fields for operating and capitalization costs in the planned and budgeted cost sections of the financial summary become read-only. The POR information updates the planned cost fields on the financial summary page automatically. The latest approved budget updates the budget fields.
Detailed Financial Plan
You can create a detailed financial plan manually, or you can populate the plan automatically from tasks or team allocations. To populate from task or team allocations, Cost Type must be selected as a grouping attribute. To populate cost and budget plans automatically with capital and operating costs, use one of the following methods:
Specify an investment-level default (Capital or Operating) for all tasks. If you do not specify a cost type, the default is Operating. You can override the default at the task or task hierarchy level for individual tasks as needed. For example, you have an investment in which most tasks have operating costs, and a few tasks have capital costs. Set the investment cost type as Operating so all tasks inherit the cost type of Operating. For each task that has capital cost, edit the cost type in those specific tasks to override the default cost type.
Specify a capital cost percentage for individual team member allocations. For example, you have six team members who are assigned to a project. Alice, one of the members, has capital cost of 15 percent. Specify the capitalization percentage for Alice. The capitalization percentage is used to calculate the percentage of operating cost and capital cost for an employee allocation. When you populate from the team allocation, Alice has two lines in the cost plan. One line shows the operating percentage and the other shows units and costs per the operating percentage.
Important! The procedures in this scenario describe the product navigation with no add-ins installed. If you have an add-in such as the PMO Accelerator installed, the navigation can vary.
The following diagram describes how a financial administrator displays capital and operating costs on summary and detailed financial plans.
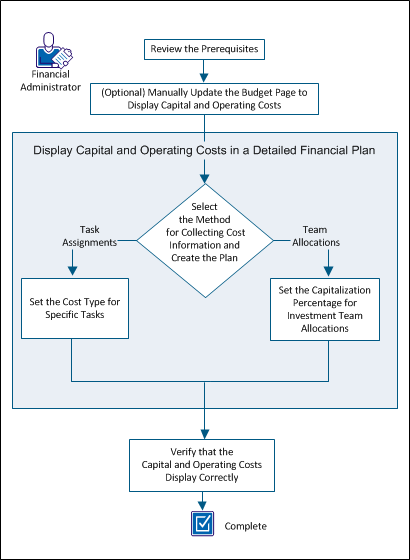
To display capital and operating costs, perform these steps:
|
Copyright © 2015 CA Technologies.
All rights reserved.
|
|
