

Use the waterline view to prioritize and rationalize the investments in your portfolio. The waterline signifies an analysis point for your list of portfolio investments. For example, the waterline might appear where the target for the primary constraint of total budget is met. By default, approved investments with the most recent finish date sort to the top of the list on the view. The unapproved investments with later finish dates sort to the bottom.
You can define rules to set up your own custom criteria to rank investments initially. As you review the list of investments during portfolio planning meetings with stakeholders, you can evaluate how the list of prioritized work compares to the set portfolio constraints of cost, benefit and resources over the time. Based on feedback from your stakeholders, you can manually fine-tune the prioritization to rationalize your current investments and override the predefined ranking rules.
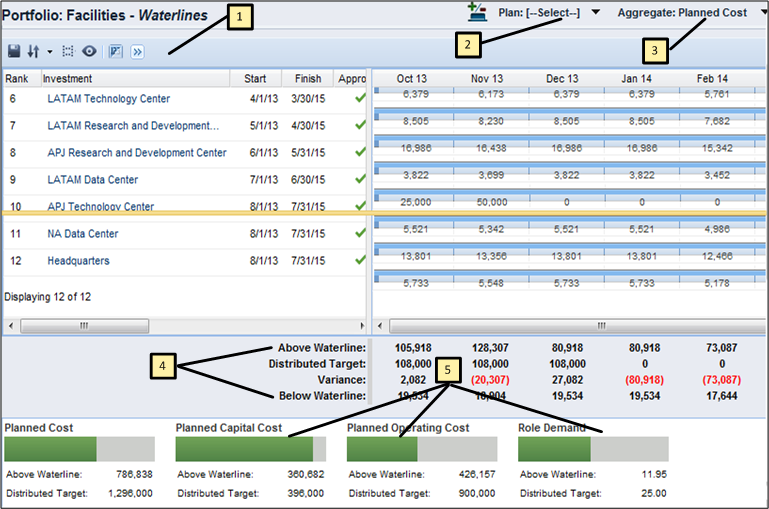
For example, you can determine a planned cost target for a portfolio plan, the set up the waterline configuration to snap to the primary constraint Planned Cost. The waterline displays in your list of investments at the point where the planned cost target is met. Everything above the waterline is within the planned cost of the portfolio, and everything below the waterline exceeds the planned cost.
While the primary constraint determines where the waterline appears in the list, ranking rules determine which investments appear above or below the waterline. You can manually override what is above the waterline by dragging the waterline itself or by dragging investments to a new place in the list. As you rearrange the waterline or investments in the list, the resulting variance between the target constraints and your portfolio totals displays.
The following illustration shows the Waterlines view and the tools that let you display the desired portfolio information:
The following diagram describes how a portfolio manager configures the waterline view.
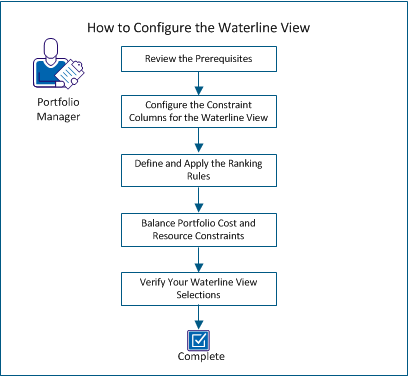
To configure the waterline view, perform these steps:
|
Copyright © 2014 CA.
All rights reserved.
|
|