

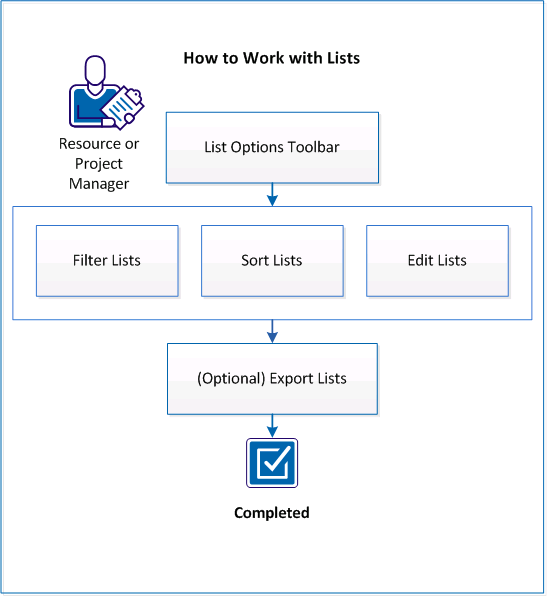
As an application user, you use CA Clarity PPM to work with lists that relate to your projects. Lists can be very long, so you can filter the list to view only what you want, sort the list to see the items in the order you want, edit the lists to update and correct information, and export lists to view and work with them in Excel.
The following process describes how an application user works with lists and filters:
Follow these steps:
The Options toolbar displays at the top of lists. The toolbar options help you manage the information included in lists.
The toolbar options let you do the following:
Lets you filter the list with criteria you select. You can expand or collapse the filter by double-clicking the toolbar or by clicking the icons (+ or -) that appear next to the filter name. The filter in use is listed in the filter field. To see a list of saved filters, click the down arrow. For more information about filters, see Filter Lists.
Lets you access options that apply to the portlet being viewed. The options that appear can vary depending on the portlet. The following list shows some of the menu options that can appear on the Options menu.
Lets you do the following:
Note: For information about settings for Gantt charts and time-scaled values, see the Personalizing CA Clarity User Guide.
Lets you sort the information in a list using multiple columns. For more information about sorting, see Sort Lists.
Exports the list to Microsoft Excel. No charts are included in this export. For more information about exporting, see Export Lists.
Note: Some lists display a Configuration icon in the Options toolbar. For these lists, you can set items that are selected from the list to display in a separate pop-up that floats above the workspace. The pop-up has the same functionality as a page presented in the workspace.
Lists with many items can span multiple pages. Use the filter fields to filter the list to only those items you want to view.
Use the Expand/Collapse Filter icon on the Options toolbar to hide or display the filter. When a list is filtered, you can return to the default results list and view all the items in the list page. Click Show All or select System Default from the Filter drop-down.
You can name a filter and save the criteria for later use. Access saved filters from the Filter drop-down.
Note: Filter fields are not case-sensitive.
Follow these steps:
You created a filter that is available from the filter drop-down.
Note: When you apply a filter to a hierarchical list, the expanded items collapse. The resulting filtered items include its parent and up the hierarchy to the top-level item, and all rows display collapsed.
A power filter is a custom filter that searches a list page by criteria you define. Use a power filter alone or with other filter fields on the list page. Only one power filter can be created for a list page.
You design and build a power filter using an expression that is divided into two parts, left and right, and separated by an operator, such as, =. For example, the expression to search for all active projects on the projects list page appears in the Expression text box as the following:
project.is_active == 1.
Follow these steps:
Note: The available fields are dependent on the page displayed.
Specifies the type of object to filter. The page refreshes.
Specifies the field to display in the Filter section. The page refreshes.
Note: The operators that are available are dependent on the object and field values that are used for the left part of the expression.
Note: The fields that are available are dependent on the page displayed.
Specifies the constant for the field.
Values: Yes or No
Example: Select the Active field of the project object and use the equals operator, then select Yes as the constant. This combination finds all active projects.
Specifies the type of object to filter. The page refreshes.
Specifies the field to display in the Filter section. The page refreshes.
The expression appears in the Expression field.
Specifies the equation type for the second half of the expression.
Defines an equation with multiple clauses.
Defines an either/or equation.
The power filter is saved. The name appears in the Power Filter field of the page filter.
You can sort lists by row or column to view the items in the order you want. Once the list is sorted, you can reset the sort to the default sort order. You can sort parent items in lists. When the list is sorted, the child items inherit the sorting criteria of the parent.
To sort a column, click the column header. When the list is sorted, an arrow appears in the column header. To reverse the sort order, click the column header again. Do the same to sort by any other column headers.
Use the Multisort option to change the sort order of columns or sort by multiple columns to change your page layout.
Follow these steps:
The sort by multiple columns page appears.
Specifies the column that leads the sort order.
Displays information in alphabetical order.
Displays information in numerical order.
Specifies the column that defines the second order of the sort.
Specifies the column that defines the third order of the sort.
Specifies the column that defines the fourth order of the sort.
You sorted a list.
When you click in a field to update, the entire list is placed into edit mode. Use the edit feature to update and correct fields in a list. You can click links and icons in other fields while the list is in edit mode. A flag appears in the field to indicate an unsaved update. Press the Esc key on your keyboard to return to display mode and discard unsaved changes.
Note: If the field can be edited, the field changes to edit mode. If no action occurs, the field cannot be edited.
In addition to editing lists, you can insert an item.
Note: If the list includes a time-scaled value column and you want to edit the time-scaled information, save your changes first.
Follow these steps:
The new row is inserted with the updated fields.
Note: Fields that are displayed are required.
You can export the information from any list portlet that displays the Export to Excel (Data Only) icon on the Options toolbar. Exporting to Excel is especially helpful when the list extends over multiple pages. To use statistical operations such as SUM and AVERAGE, export and view the list in Excel format.
Note: If the Export to Excel icon is not displayed, the list is restricted.
The following rules apply when you export information in a list:
Important! Expect certain changes in how information is displayed in Excel when you export CA Clarity PPM information to Microsoft Excel.
Before you export information, verify that you are exporting the returned results and have not applied any pagination.
Follow these steps:
The file download page appears.
You exported a list to be able to and work with it in Excel.
Some lists display a Configuration icon in the Options toolbar. For these lists, you can set items selected from the list to display in a separate pop-up that floats above the workspace. A pop-up is one way to provide a visual reminder of where you are in the application. The popup has the same functionality as a page presented in the workspace.
Note: When you set an item on a list page to appear in a pop-up, all list items are set to appear in a pop-up.
Follow these steps:
For example, to open the Projects list page, open the Home menu, and from Portfolio Management, click Projects.
The pop-up setting is complete. Any item you click in the list appears in a separate pop-up window.
You can use the three-dimensional and animation charting capabilities to organize and visually represent complex information. With charts, you can do the following:
You can display charts from any portlet page, such as the overview page or dashboards. You can add charts by personalizing pages or your CA Clarity PPM administrator can add charts using Studio.
For more information, see the Personalizing CA Clarity PPM User Guide.
For more information, see the Studio Developer’s Guide.
You can print, slice, or rotate charts by setting chart options.
Right-click a chart to set the following chart options:
The following table describes the available options for each chart.
|
Chart Type |
View 2-D |
Slicing |
Rotation |
|
Area |
Yes |
No |
No |
|
Bar |
No |
No |
No |
|
Bubble |
No |
No |
No |
|
Column |
Yes |
No |
No |
|
Funnel |
Yes |
Yes |
No |
|
Line |
Yes |
No |
No |
|
Pie |
Yes |
Yes |
Yes |
|
Scatter |
Yes |
No |
No |
|
Copyright © 2013 CA.
All rights reserved.
|
|