By Example: Interactive Portlet using Web Services Connection Method › The Solution: Create an Xcelsius Visualization with Real-Time CA Clarity PPM Data › Test the Visualization and Create an Interactive Portlet
Test the Visualization and Create an Interactive Portlet
Samantha now views the visualization in Xcelsius to make certain the connection is good and data is moving from CA Clarity PPM to Xcelsius. When the test is done, Samantha can create the interactive portlet that displays the visualization in CA Clarity PPM
- In Xcelsius, Samantha selects Preview from the File menu.
She sees that information is populating the bar graph and determines that the visualization is working exactly as designed.
- From the File menu, Samantha selects Export, and then selects Flash (SWF).
She indicates a place on her computer where the SWF file (capDemand.swf) is to be stored.
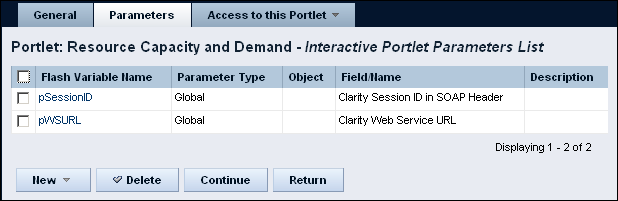
- In CA Clarity PPM, Samantha creates the Resource Capacity and Demand interactive portlet using Studio and imports the capDemand.swf file.
- Samantha defines the following global parameters for the new interactive portlet with the same names as the Flash variables created in Xcelsius:
- In Studio, Samantha adds the new interactive portlet to a Resource dashboard.
- Samantha opens the Resource dashboard and looks at the data in the new interactive portlet.
- Samantha sends William a message that he can open the Resource dashboard and see the data he requested.

