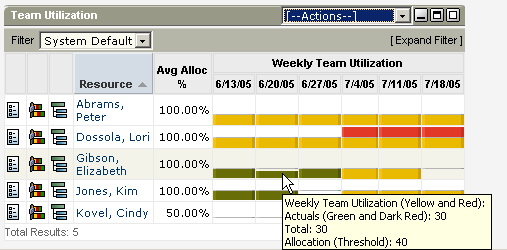
Use the Team Utilization portlet to view total effort (actuals + remaining ETC) for each staff member who is assigned to project tasks. By default, this portlet's graph displays aggregate effort by each staff member. Aggregate in this case refers to the effort for all of the tasks to which they are assigned. However, you can drill down through the graph to view individual effort by individual task.

Data is displayed on this portlet by resource by time period. The time period columns are, by default, set to weekly, and always start with the current week. When you scroll over a time period, a note appears that provides a brief summary of what you see. In this example, the note explains that while resource Gibson was allocated for 40 hours during the week of 6/13/05, she actually worked only 30. Scrolling over the week of 7/4/05 for resource Dossola displays her Allocation Threshold (in yellow) is 40 hours, she has been booked (in red) for 80.
The allocation color code works as follows:
You can change any of the values in the Team Utilization portlet, including the color codes. The following list describes the Team Utilization portlet columns and icons:
Click to go to open the staff member's properties page.
Note: See the Resource Management User Guide for more information.
Click this icon to open the resource's Resource/Role Allocations page.
Note: See the Resource Management User Guide for more information.
Click this icon to open the Project Tasks: Task Resource Utilization List page for that resource.
Click a resource's name to open the resource's General Properties page.
Displays the average percentage of available time that a resource is allocated to the tasks to which they are assigned.
Displays the time periods, and vary according to the selected Time Scaled Values options. Data for the time periods is displayed in a colored histogram.
Default: Weekly
Values:
| Copyright © 2010 CA. All rights reserved. | Email CA Technologies about this topic |